Using the spreadsheet plugins
Installing the add-in (Excel)
Open now an Excel worksheet. Click on the 'Insert' tab on the screen.
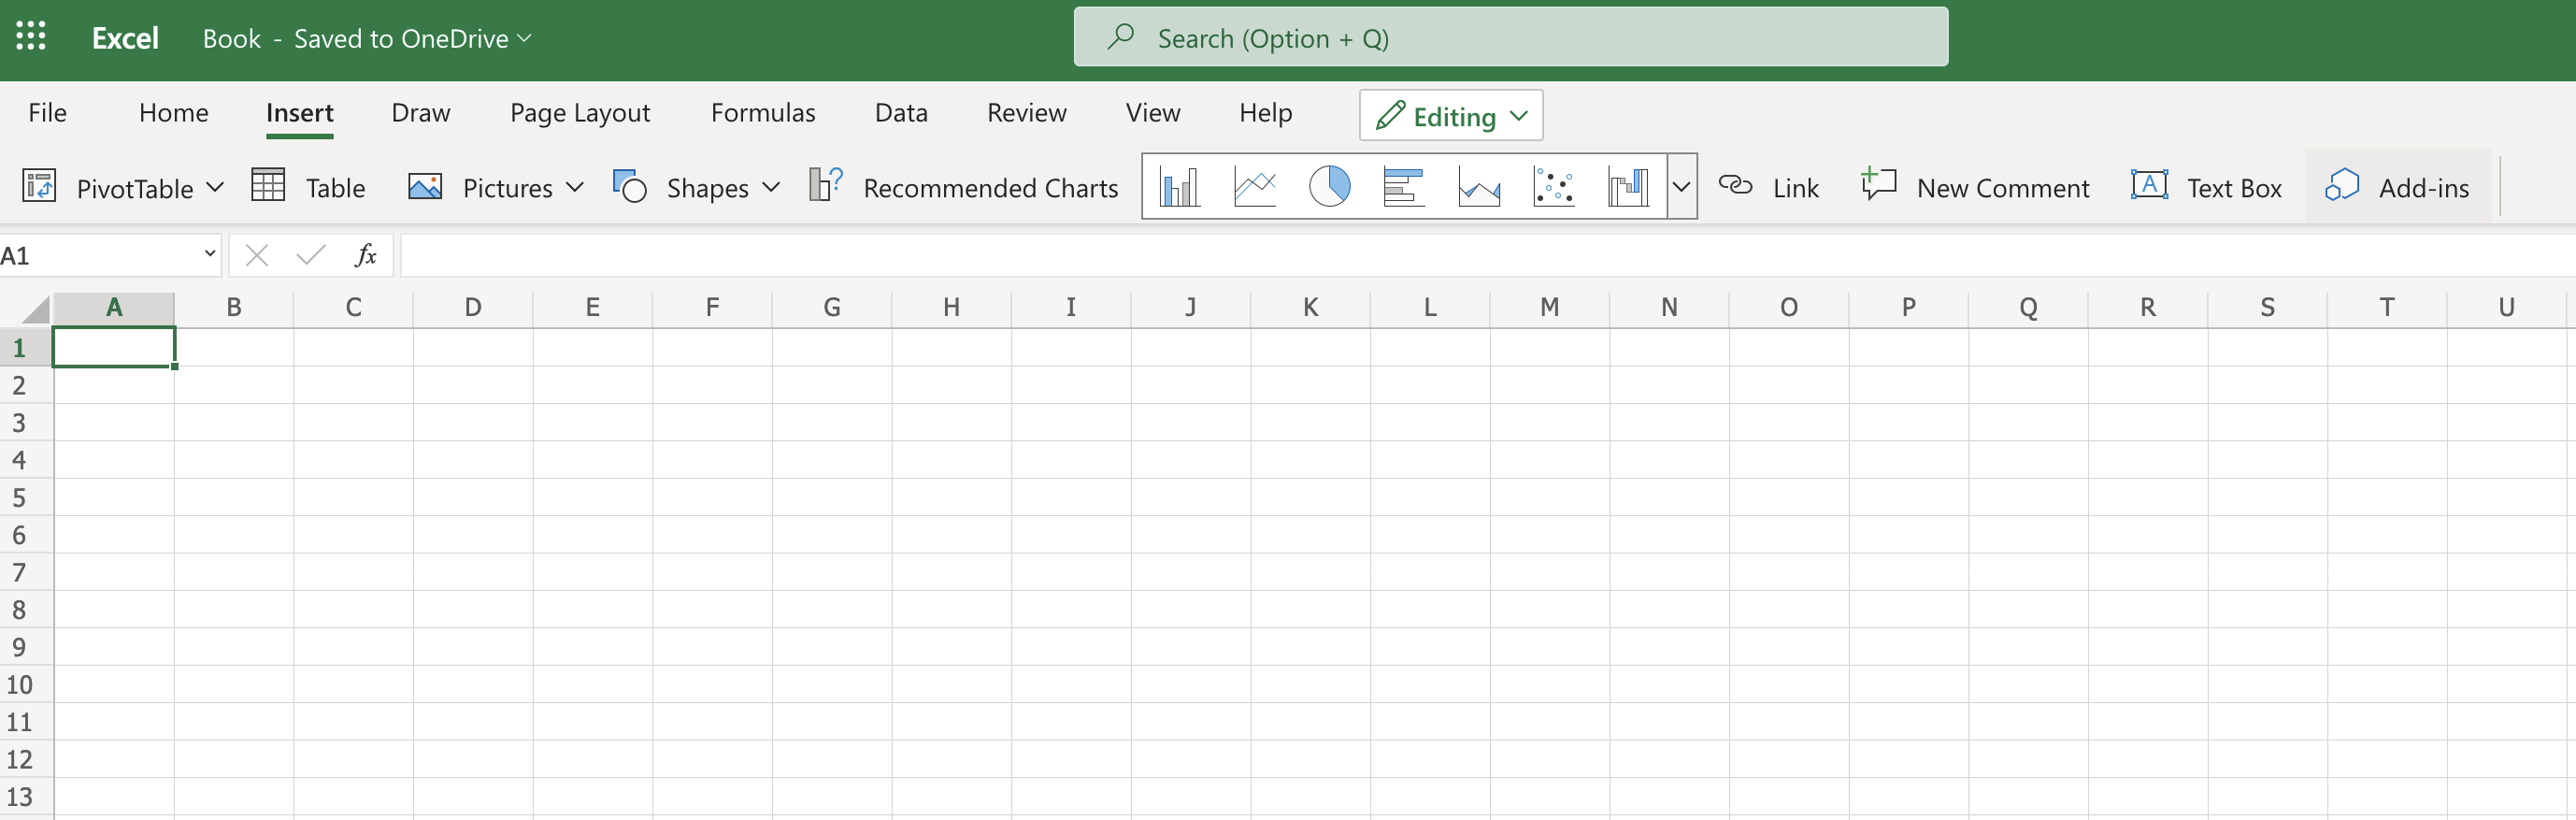
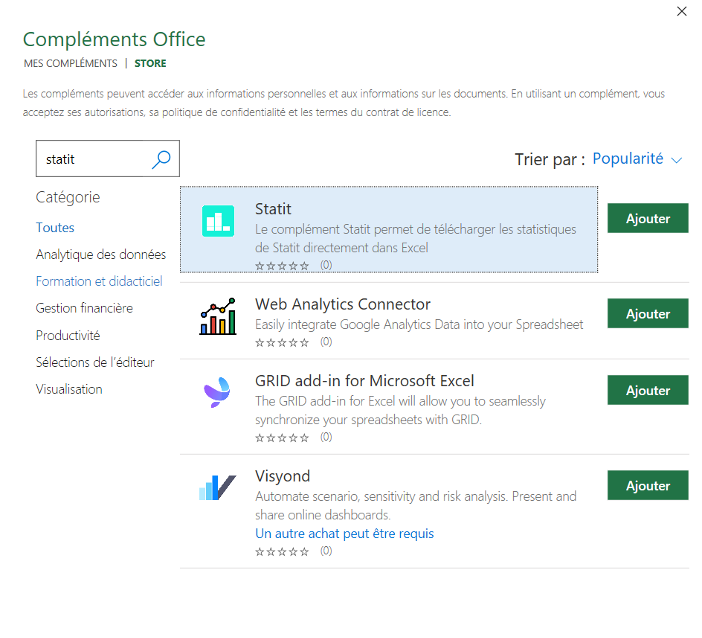
Look for « Add-Ins ». Click on the Store and search for « statit ». Click on Add.
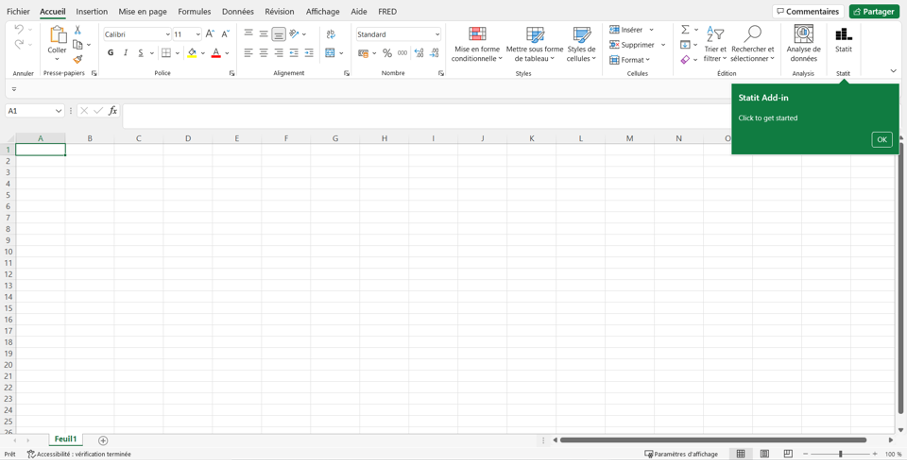
You are there. The add-in is now installed and available in the top menu. Look for the Statit name and logo.
If Microsoft Excel is managed by your organisation, you might not have the rights to install an add-in. If the set-up is forbidden, ask your administrator for help.
Installing the add-on (Google Sheets)
Open Google Sheets. Click on the 'Extensions' tab on the navigation bar.
Select 'Add-ons' and then 'Get add-ons'. This will take you to the Google Workspace marketplace.
In the 'Search' area, type in 'Statit'. This will take you to the add-on's main page.
Select 'Install' and follow instructions.
Once the add-on is installed, get started by clicking on the 'Statit' tab on the main menu.
The Google Sheets add-on is currently in beta and will be released publicly soon. If you are would like to try it out, please get in touch here
Using functions
To get started, type in any cell the formula =STATIT_OBS("xr/monthly/eur/gbp"). All Statit functions will start with STATIT followed by a keyword. STATIT_OBS allows you to get the latest value of a serie.
If the add-in installation worked, you will get the result after a few seconds.
Now copy paste the formula =STATIT_SERIE("xr/monthly/eur/gbp"). This should return an array with two columns. The first one represents the date of the observation, the second one represents the value of the observation.
The date is represented as a number as this is the way it is coded in Excel. To make sense, select the date column and format it as a Date.
If all works fine, jump straight to the next section. Note that all examples use international formating with function arguments separated with a ",". In certain countries, you might have to replace the commas with a ";".
If you are facing problems, look at the troubleshooting section at the end of the page.
Observation functions
These functions return the most recent value of the serie
STATIT_OBS
This function will display the value of the last observation for a serie
- Parameter: id - for example, "xr/monthly/eur/gbp"
- Parameter: end (optional) - the end date for the last observation
- Returns: number - the latest value of the serie in a single cell, for example 1.08
Examples:
- =STATIT_OBS("xr/monthly/eur/gbp")
- =STATIT_OBS("xr/monthly/eur/gbp", 2021)
STATIT_OBS_SUM
This function will sum the last values of the serie
- Parameter: id - for example, "xr/monthly/eur/gbp"
- Parameter: periods (optional) - the number of periods considered
- Parameter: end (optional) - the end date for the last observation
- Returns: number - the latest value of the serie in a single cell, for example 1.08
Examples:
- =STATIT_OBS_CHANGE("xr/monthly/eur/gbp")
- =STATIT_OBS_CHANGE("xr/monthly/eur/gbp", 5)
STATIT_OBS_CHANGE
This function will get the change between the last value of the serie and another one
- Parameter: id - for example, "xr/monthly/eur/gbp"
- Parameter: periods (optional) - the number of periods considered
- Parameter: end (optional) - the end date for the last observation
- Returns: number - the latest value of the serie in a single cell, for example 1.08
Examples:
- =STATIT_OBS_CHANGE("xr/monthly/eur/gbp")
- =STATIT_OBS_CHANGE("xr/monthly/eur/gbp", 5)
STATIT_OBS_CHANGE_PERCENT
This function will get the change in percentage between the last value of the serie and another one
- Parameter: id - for example, "xr/monthly/eur/gbp"
- Parameter: periods (optional) - the number of periods considered
- Parameter: end (optional) - the end date for the last observation
- Returns: number - the latest value of the serie in a single cell, for example 1.08
Examples:
- =STATIT_OBS_CHANGE_PERCENT("xr/monthly/eur/gbp")
- =STATIT_OBS_CHANGE_PERCENT("xr/monthly/eur/gbp", 5)
STATIT_OBS_DATE
This function will display the date of the last observation
- Parameter: id - for example, "xr/monthly/eur/gbp"
- Parameter: end (optional) - the end date for the last observation
- Returns: number - the latest value of the serie in a single cell, for example 1.08
Example:
- =STATIT_OBS_DATE("xr/monthly/eur/gbp")
- =STATIT_OBS_DATE("xr/monthly/eur/gbp", 2022)
Point functions
These functions will return the date and value of the last observation
STATIT_POINT
This function will get all observations for a serie with their dates and values. This is useful when we need the full historic perspective on the serie
- Parameter: id - for example, "world-bank/pink/prices/agri/orange/usd"
- Parameter: end (optional) - the end date for observations
- Returns: an array with a a list of values and dates
Examples:
- =STATIT_POINT("world-bank/pink/prices/agri/orange/usd")
- =STATIT_POINT("world-bank/pink/prices/agri/orange/usd",2021)
STATIT_POINT_SUM
Gets all observations for a serie summed over a period of time
- Parameter: id - for example, "world-bank/pink/prices/agri/orange/usd"
- Parameter: periods (optional) - the number of periods considered
- Parameter: end (optional) - the end date for observations
- Returns: an array with a a list of values and dates
Examples:
- =STATIT_POINT_SUM("world-bank/pink/prices/agri/orange/usd")
- =STATIT_POINT_SUM("world-bank/pink/prices/agri/orange/usd",6)
- =STATIT_POINT_SUM("world-bank/pink/prices/agri/orange/usd",6,2021)
STATIT_POINT_AVERAGE
Gets all observations for a serie averaged over a period of time
- Parameter: id - for example, "world-bank/pink/prices/agri/orange/usd"
- Parameter: periods (optional) - the number of periods considered
- Parameter: end (optional) - the end date for observations
- Returns: an array with a a list of values and dates
Examples:
- =STATIT_POINT_AVERAGE("world-bank/pink/prices/agri/orange/usd")
- =STATIT_POINT_AVERAGE("world-bank/pink/prices/agri/orange/usd",6)
- =STATIT_POINT_AVERAGE("world-bank/pink/prices/agri/orange/usd",6,2021)
STATIT_POINT_CHANGE
Gets the absolute changes between observations over a period of time
- Parameter: id - for example, "world-bank/pink/prices/agri/orange/usd"
- Parameter: periods (optional) - the number of periods considered
- Parameter: end (optional) - the end date for observations
- Returns: an array with a a list of values and dates
Examples:
- =STATIT_POINT_CHANGE("world-bank/pink/prices/agri/orange/usd")
- =STATIT_POINT_CHANGE("world-bank/pink/prices/agri/orange/usd",6)
- =STATIT_POINT_CHANGE("world-bank/pink/prices/agri/orange/usd",6,2021)
STATIT_POINT_CHANGE_PERCENT
Gets the changes in percentage between observations over a period of time
- Parameter: id - for example, "world-bank/pink/prices/agri/orange/usd"
- Parameter: periods (optional) - the number of periods considered
- Parameter: end (optional) - the end date for observations
- Returns: an array with a a list of values and dates
Examples:
- =STATIT_POINT_CHANGE_PERCENT("world-bank/pink/prices/agri/orange/usd")
- =STATIT_POINT_CHANGE_PERCENT("world-bank/pink/prices/agri/orange/usd",6)
- =STATIT_POINT_CHANGE_PERCENT("world-bank/pink/prices/agri/orange/usd",6,2021)
Serie Functions
These functions will return the observations of a serie
STATIT_SERIE
This function will get all observations for a serie with their dates and values. This is useful when we need the full historic perspective on the serie
- Parameter: id - for example, "world-bank/pink/prices/agri/orange/usd"
- Parameter: start (optional) - the starting date for observations
- Parameter: end (optional) - the end date for observations
- Parameter: direction (optional) - the direction of the observation, 1 for the chronological order, -1 for the opposite
- Returns: an array with a a list of values and dates
Examples:
- =STATIT_SERIE("world-bank/pink/prices/agri/orange/usd")
- =STATIT_SERIE("world-bank/pink/prices/agri/orange/usd",2021)
- =STATIT_SERIE("world-bank/pink/prices/agri/orange/usd",2021,,-1)
STATIT_SERIE_SUM
Gets all observations for a serie summed over a period of time
- Parameter: id - for example, "world-bank/pink/prices/agri/orange/usd"
- Parameter: periods (optional) - the number of periods considered
- Parameter: start (optional) - the starting date for observations
- Parameter: end (optional) - the end date for observations
- Parameter: direction (optional) - the direction of the observations, 1 for the chronological order, -1 for the opposite
- Returns: an array with a a list of values and dates
Examples:
- =STATIT_SERIE_SUM("world-bank/pink/prices/agri/orange/usd")
- =STATIT_SERIE_SUM("world-bank/pink/prices/agri/orange/usd",6)
- =STATIT_SERIE_SUM("world-bank/pink/prices/agri/orange/usd",6,2021)
- =STATIT_SERIE_SUM("world-bank/pink/prices/agri/orange/usd",6,2021,2023,-1)
STATIT_SERIE_AVERAGE
Gets all observations for a serie averaged over a period of time
- Parameter: id - for example, "world-bank/pink/prices/agri/orange/usd"
- Parameter: periods (optional) - the number of periods considered
- Parameter: start (optional) - the starting date for observations
- Parameter: end (optional) - the end date for observations
- Parameter: direction (optional) - the direction of the observation, 1 for the chronological order, -1 for the opposite
- Returns: an array with a a list of values and dates
Examples:
- =STATIT_SERIE_AVERAGE("world-bank/pink/prices/agri/orange/usd")
- =STATIT_SERIE_AVERAGE("world-bank/pink/prices/agri/orange/usd",6)
- =STATIT_SERIE_AVERAGE("world-bank/pink/prices/agri/orange/usd",6,2021)
- =STATIT_SERIE_AVERAGE("world-bank/pink/prices/agri/orange/usd",6,2021,2023,-1)
STATIT_SERIE_CHANGE
Gets the absolute changes between observations over a period of time
- Parameter: id - for example, "world-bank/pink/prices/agri/orange/usd"
- Parameter: periods (optional) - the number of periods considered
- Parameter: start (optional) - the starting date for observations
- Parameter: end (optional) - the end date for observations
- Parameter: direction (optional) - the direction of the observation, 1 for the chronological order, -1 for the opposite
- Returns: an array with a a list of values and dates
Examples:
- =STATIT_SERIE_CHANGE("world-bank/pink/prices/agri/orange/usd")
- =STATIT_SERIE_CHANGE("world-bank/pink/prices/agri/orange/usd",6)
- =STATIT_SERIE_CHANGE("world-bank/pink/prices/agri/orange/usd",6,2021)
- =STATIT_SERIE_CHANGE("world-bank/pink/prices/agri/orange/usd",6,2021,2023,-1)
STATIT_SERIE_CHANGE_PERCENT
Gets the changes in percentage between observations over a period of time
- Parameter: id - for example, "world-bank/pink/prices/agri/orange/usd"
- Parameter: periods (optional) - the number of periods considered
- Parameter: start (optional) - the starting date for observations
- Parameter: end (optional) - the end date for observations
- Parameter: direction (optional) - the direction of the observation, 1 for the chronological order, -1 for the opposite
- Returns: an array with a a list of values and dates
Examples:
- =STATIT_SERIE_CHANGE_PERCENT("world-bank/pink/prices/agri/orange/usd")
- =STATIT_SERIE_CHANGE_PERCENT("world-bank/pink/prices/agri/orange/usd",6)
- =STATIT_SERIE_CHANGE_PERCENT("world-bank/pink/prices/agri/orange/usd",6,2021)
- =STATIT_SERIE_CHANGE_PERCENT("world-bank/pink/prices/agri/orange/usd",6,2021,2023,-1)
Series functions
These functions will return the observations of multiple series
STATIT_SERIES
This function will get all observations for a serie with their dates and values. This is useful when we need the full historic perspective on the serie
- Parameter: ids - an array of series, for instance, set "world-bank/pink/prices/agri/orange/usd" and "world-bank/pink/prices/agri/banana_us/usd" in A1 and B1 and provide A1:B1 as input to the function
- Parameter: start (optional) - the starting date for observations
- Parameter: end (optional) - the end date for observations
- Parameter: direction (optional) - the direction of the observation, 1 for the chronological order, -1 for the opposite
- Returns: an array with a a list of values and dates
Examples:
- =STATIT_SERIES(A1:A2)
- =STATIT_SERIES(A1:A2,2021)
- =STATIT_SERIES(A1:A2,2018,2019,-1)
Troubleshooting
There are different possible issues
The function is not recognised
In this case, when you type =STATIT in any cell, Excel does not recognise the function. When you have finished typing, Excel return something like #NAME?. This means that the custom function is not yet recognised by Excel.
The first option is check if the function has been loaded. Try clearing the add-in cache on the top right hand side of the add-in on the right and reloading the add-in. If it still does not work, try restarting Excel and try again.
The second option is to clear Excel cache. This is not harmful operation. Please check online Microsoft documentation for "clearing excel cache". At the time of writing, documentation was located here.
If this still does not work, please get in touch with us at help@gostatit.com
An error occured
Other common types of errors are: - you have no internet connection - you need to fill-in your username and password - the id you are using does not exist or you do not have the permission to access it
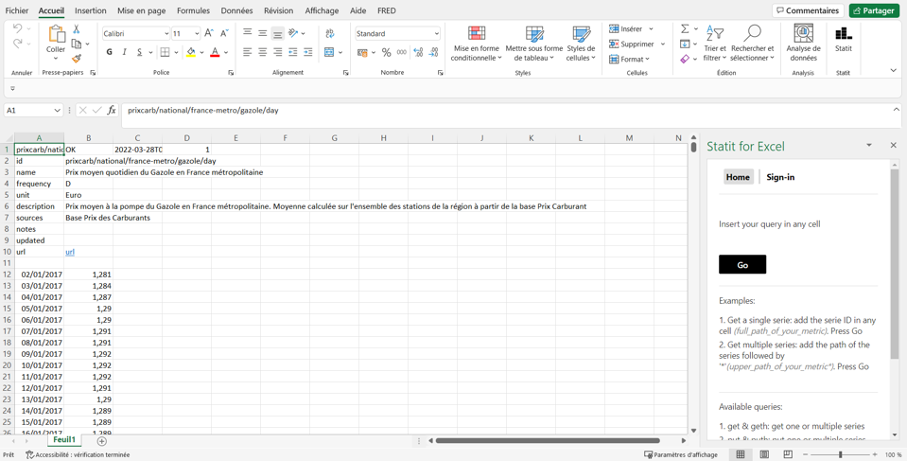
Using the taskpane (Excel)
You have two ways to get series in your workbook: custom functions and the taskpane. In this page, we will look at the taskpane.
Downloading a serie
To download a single serie, write in any cell the identifier of a public collection.
Take for instance the serie 'eustat/apro_mk_colm/de/raw_milk_delivered' that represents the volumes of milk delivered by farms in Germany.
Select the cell with the serie and click on "Go". That is it. After a few seconds, the serie is available in the sheet
Downloading a serie horizontally
Another way to download the serie above is to write in a cell 'get:eustat/apro_mk_colm/de/raw_milk_delivered' (do not put '').
'get' is used to download a serie vertically. 'geth' is used to get a serie horizontally.
In a different place in the worksheet, write 'geth:eustat/apro_mk_colm/de/raw_milk_delivered'. Select the cell. Click go. The serie appears now horizontally
Downloading multiple series
It is possible to download multiple series with a single call. You only have to separate them with commas.
The formula 'get:xr/monthly/eur/cad,xr/monthly/eur/aud,xr/monthly/eur/usd' lets you download the three exchange rate series (CAD, AUD, USD) against Euro.
Downloading all series from a collection
It is possible to download multiple series from the same collection (or from the same directory, remember, a collection is organised like a directory of files).
For instance, to get all monthly metrics against Euro, you can use the following formula 'get:xr/monthly/eur/*'. '*' means all series with an identifier starting with 'xr/monthly/eur/'.
Signing-in (Excel)
All collections of series included in this tutorial can be accessed without signin-in.
If you want to access other series, you might be requested to create an account and sign-in to Statit.
Please head over here if you need to create one.
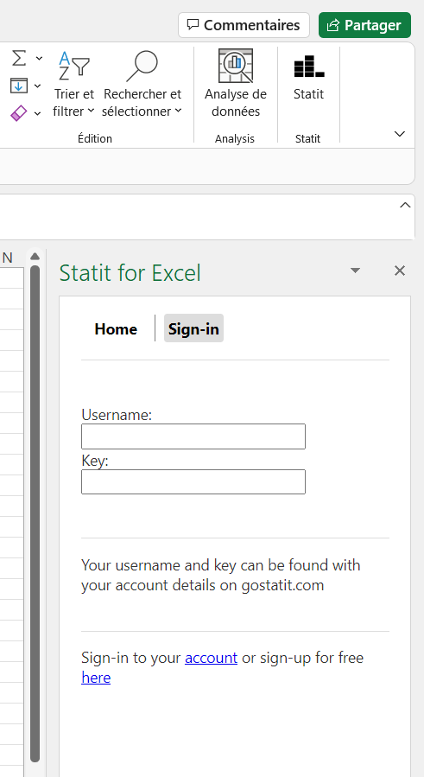
Authentication
Once you have an account, you will need to use your credentials in the add-on.
Click on the 'Statit' button in the top menu. A window opens on the right of the worksheet. Click on the 'Settins' tab on the top of the window.
Fill-in your « username » and your API key. You will find both in the "My account" space accessed by the top right menu in the Statit website when you are signed-in.