A metrics library
Statit is an online library designed to host metrics.
What we call a metric
We call metrics the measure of something over time.
Metrics are used in many fields: finance, business, economics, social sciences, environmental sciences ...
The average daily temperature in Copenhagen, monthly confidence index in the building sector in France, weekly exports of wheat in Romania can all be represented by metrics.
On Statit, we will often use term 'series' instead of metrics. Both mean the same for us.
Statit hosts metrics and every metric has a unique identifier on the platform.
Accessing your first metric
Here are three series with their identifiers:
- Average daily temperature in Copenhagen: clim/copernicus-r/daily/dk01/temp/real
- Monthly confidence index in building sector in France: bdfconj/consn/bat/total/ica/cvs_3m
- Weekly wheat export volumes in Romania: eu-agri/cereals_trade_weekly/exports/ro/wheat-common/weekly
Click on the first link above to access the serie.
The description
On the page, you see:
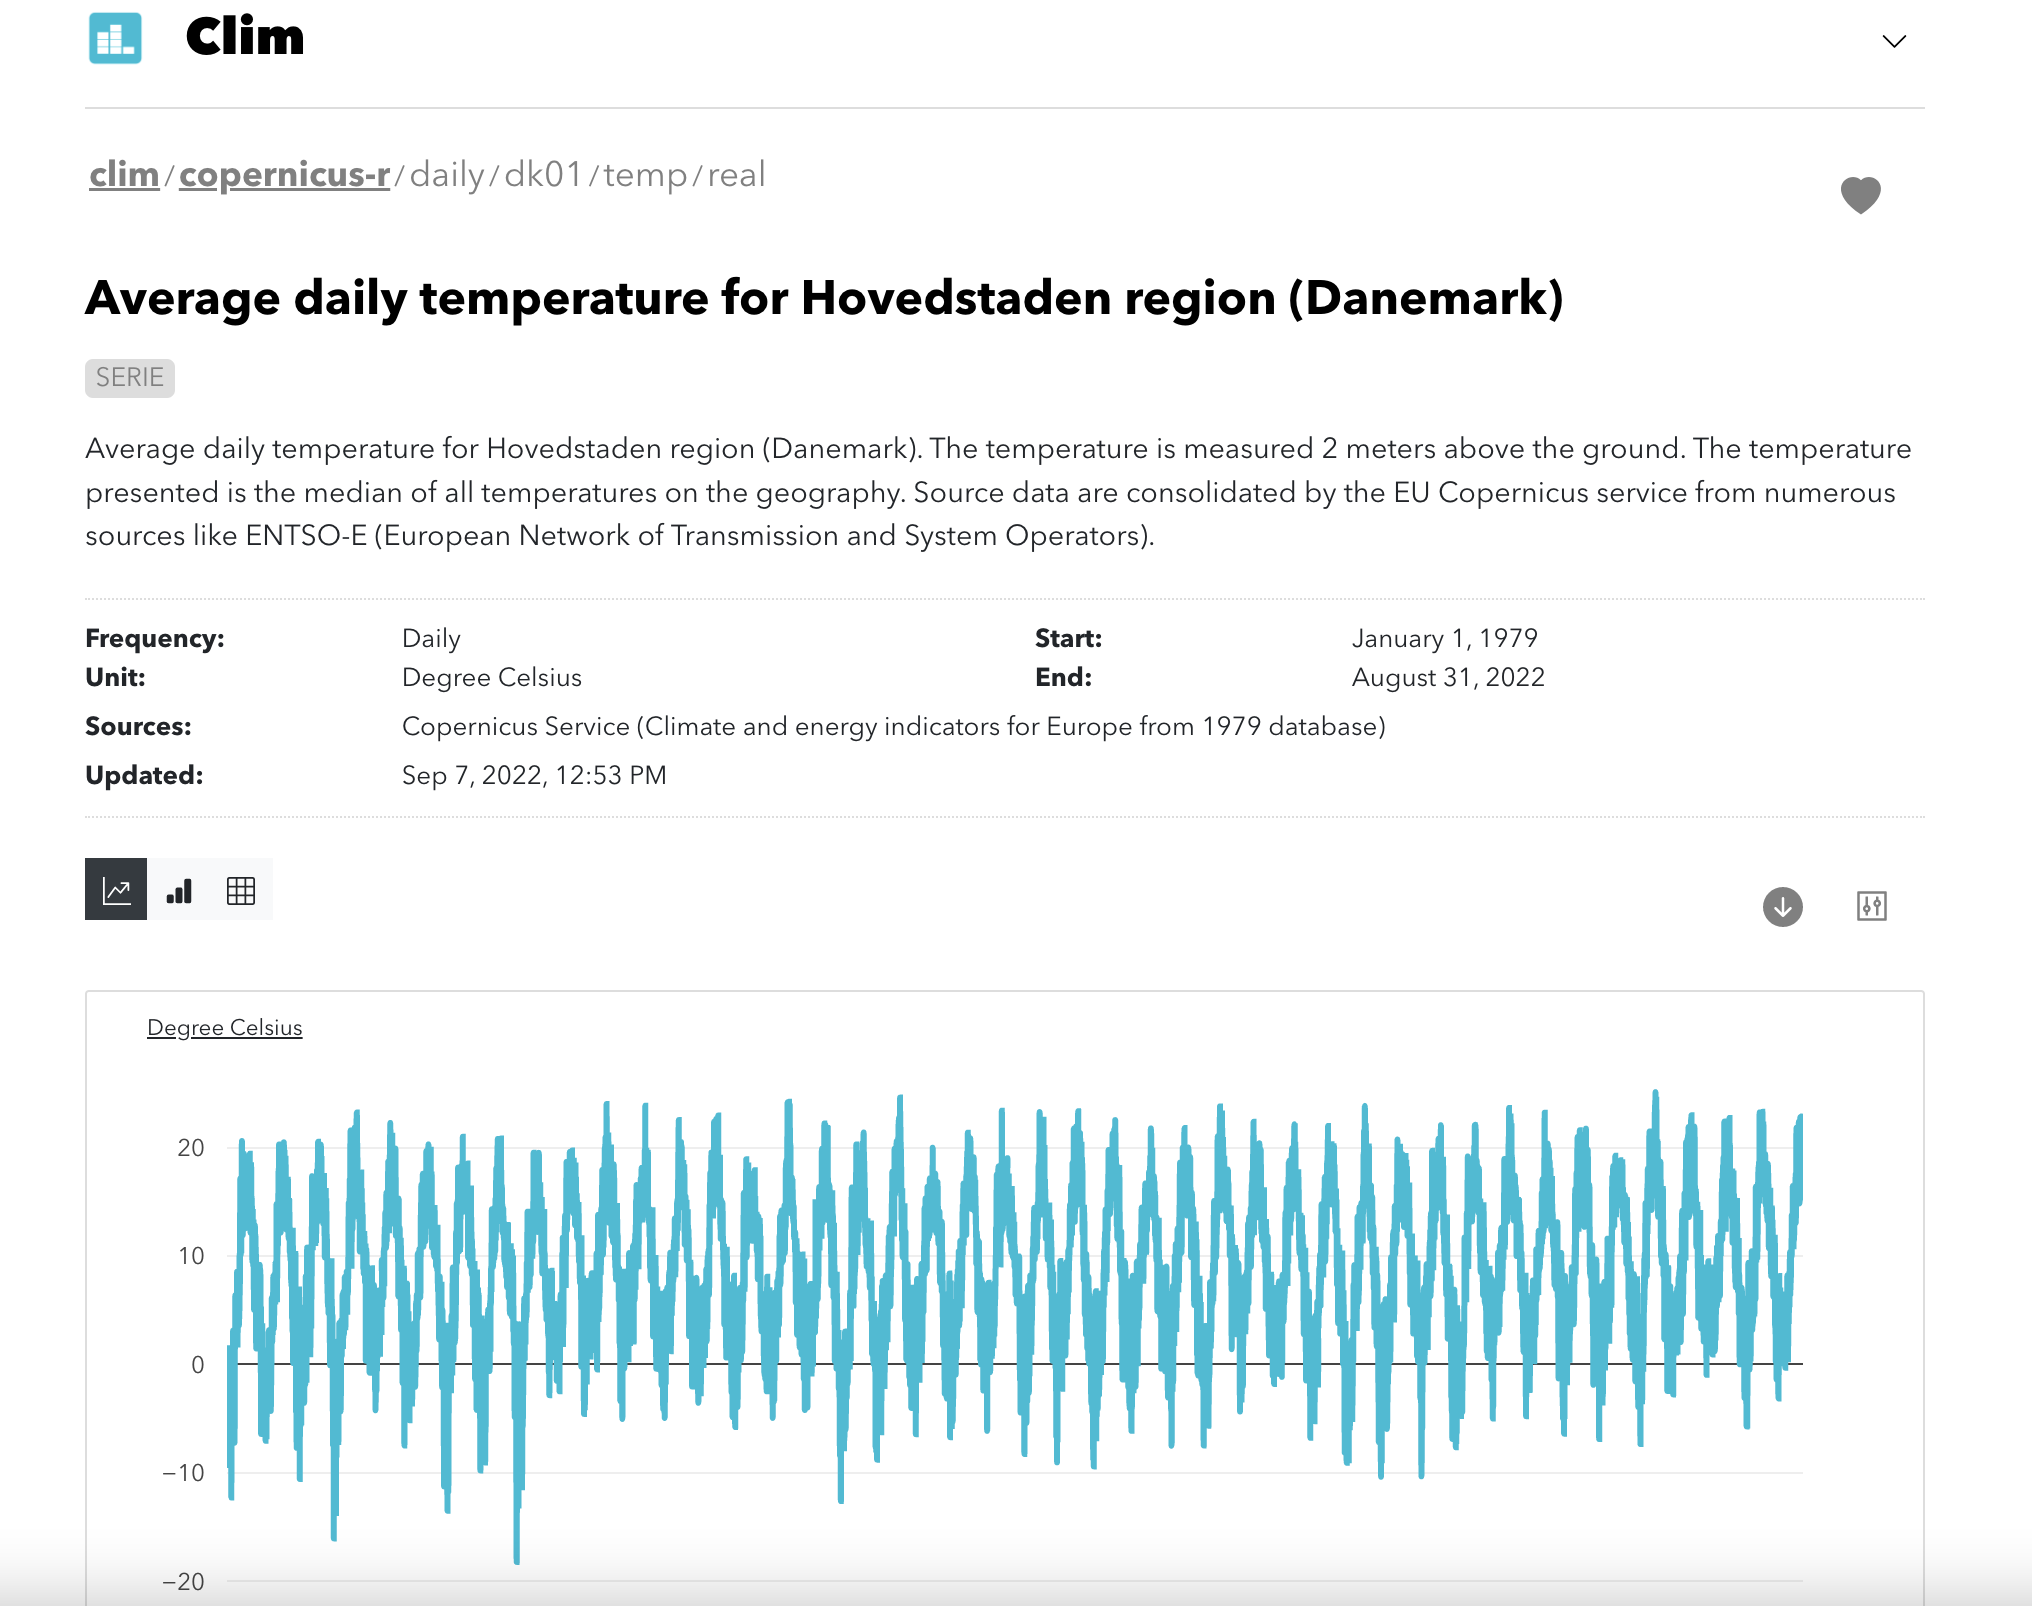
- the name of the serie: Average daily temperature for Hovedstaden region (Denmark)
- its description: Average daily temperature for Hovedstaden region (Denmark) ...
And below:
- the frequency of observations: Daily
- the unit: Degree Celsius
- the sources: Copernicus Service
- the starting and end date of the serie and the date of the last update
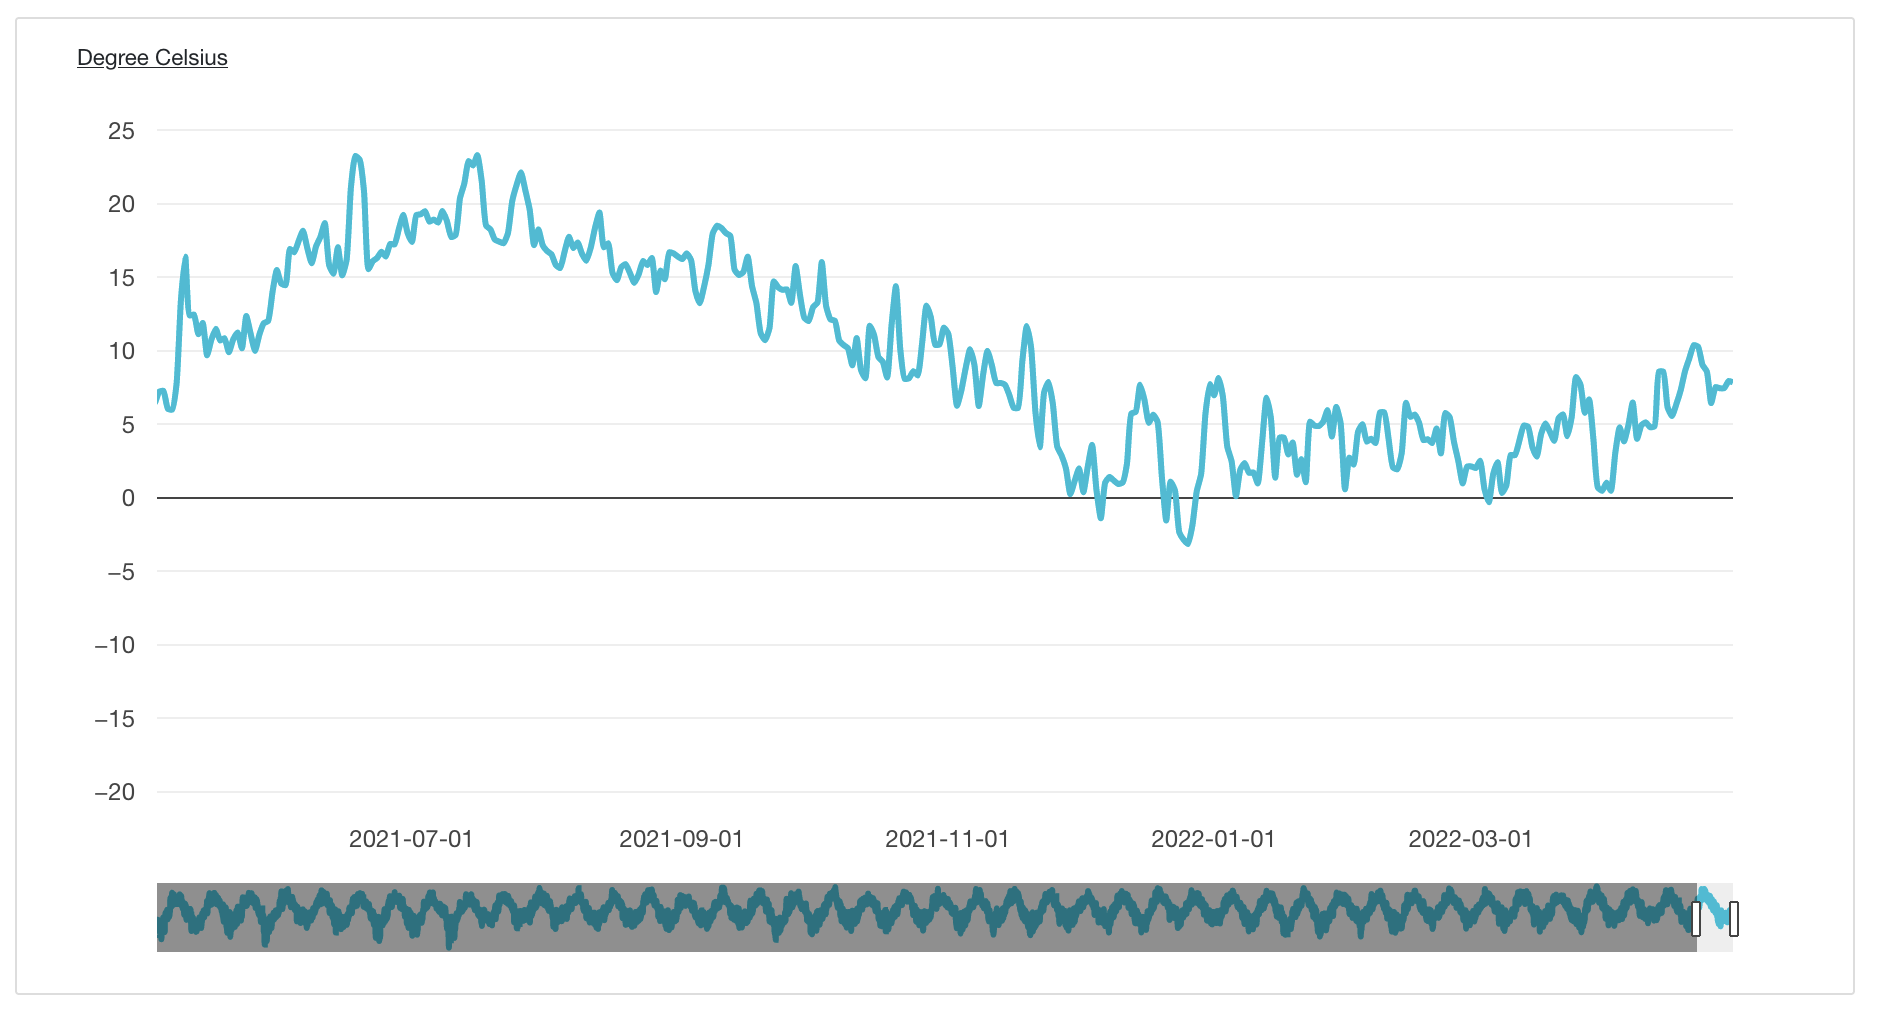
Below, you can view the serie as a line chart. If you move your mouse over the chart, you will be able to see the values.
Finally, at the bottom of the chart, the grey area allows you to select a specific time period.
Try for instance to select the 2021 year by pulling the "left handle" towards the right.
Reading values
You can click on the small icons above the chart on the left to change the view to a bar chart or values. Click on the grid to see the values.
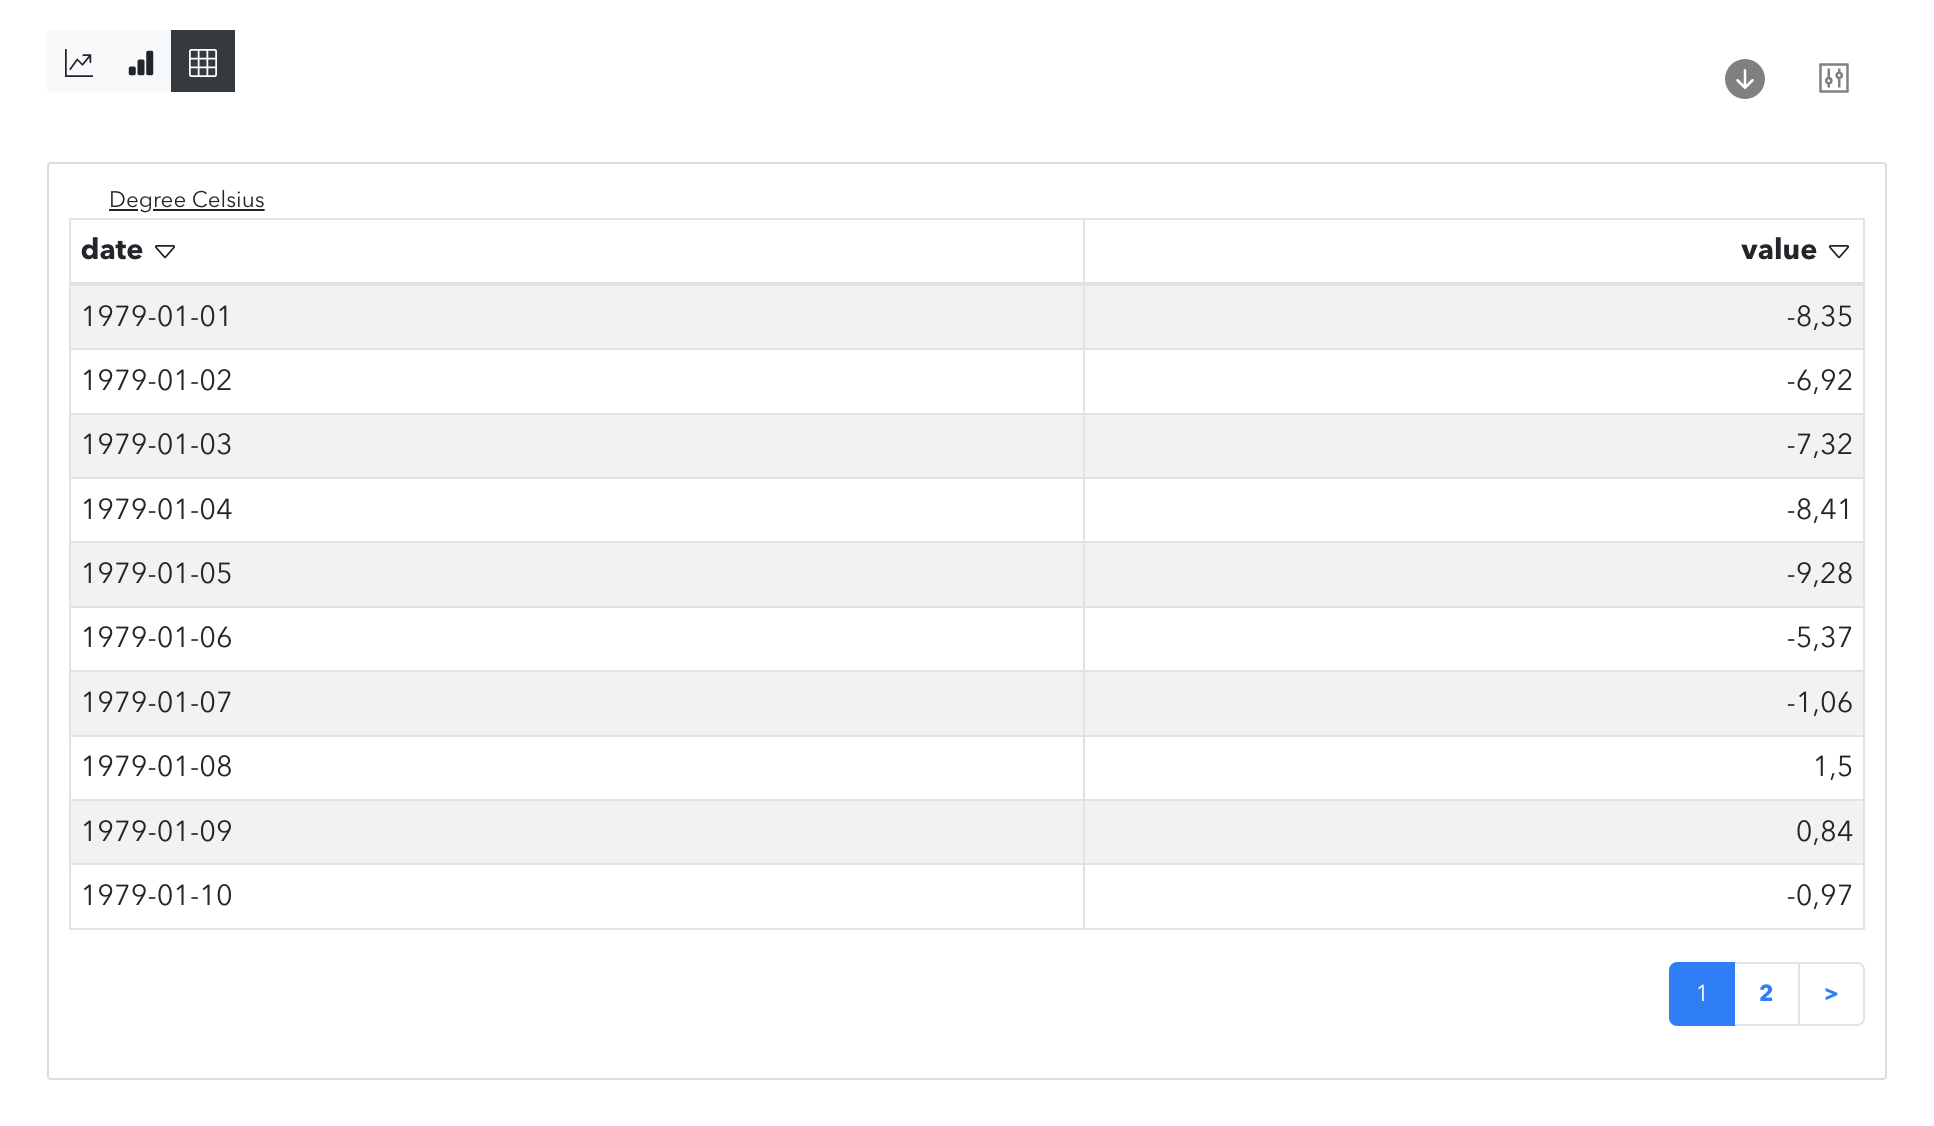
You can then sort the lines by date or by value by clicking on the arrows above the columns.
Downloading the serie
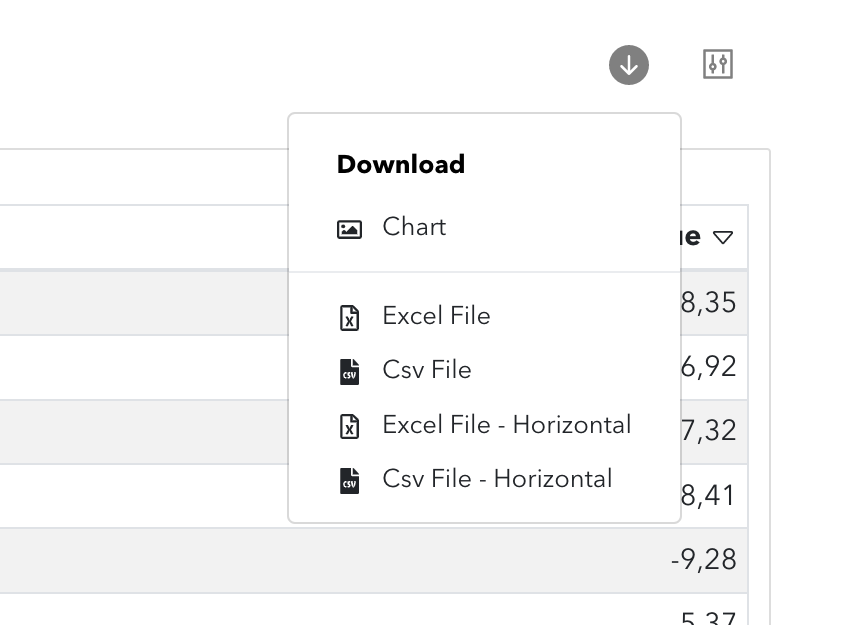
On the top right of the chart, click on the icon with an downward arrow.
You can download the chart as an image or the values in an Excel ou CSV file (with vertical or horizontal values).
Create an account here to download the serie. It is free and takes 2 minutes.
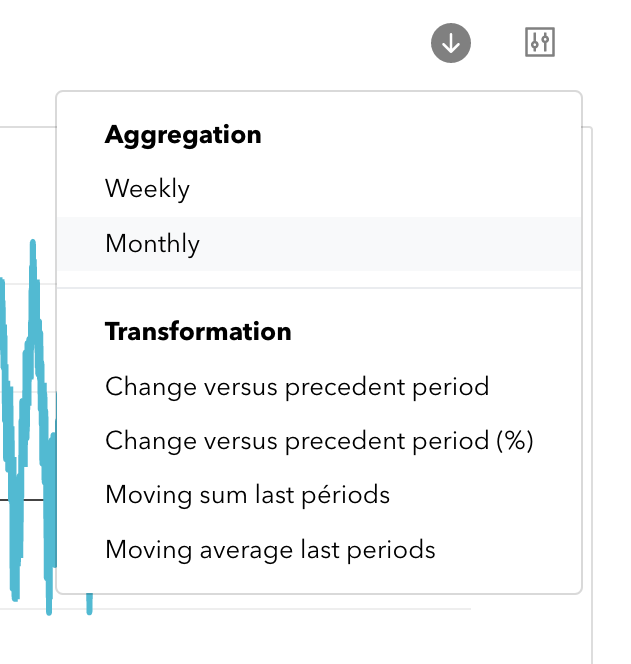
Perform preliminary analysis
You can perform preliminary analysis on the serie to better put in perspective the values.
Click on the icon on the right of the download menu.You can aggregate values on different time periods or make simple transformations (for instance, view variations between values).
Try aggregating the values by month
Public or private
You have been able to access the serie above without having to create an account or sign-in.
Statit hosts both public series accessible to all on the Internet and private series only accessible to authenticated users.
We will use public series in the user guide.
Next steps
Well done, you have accessed your first serie. We will now explain how to browse series inside collections.