Dashboard
To monitor even more closely the series you are interested in, Statit allows you to pull them together in your own dashboards.
Creating the dashboard
To start, we are going to create a personal dashboard.
Our goal is to create a dashboard to monitor various energy prices internationally.
Go on the home page of your account by clicking on "Home" in the menu on the top right of the page.
Click on the "Dashboard" tab, then on the button "Create a dashboard" just under.
You are reaching the following screen. You are now going to give an identifier and a name to your dashboard.
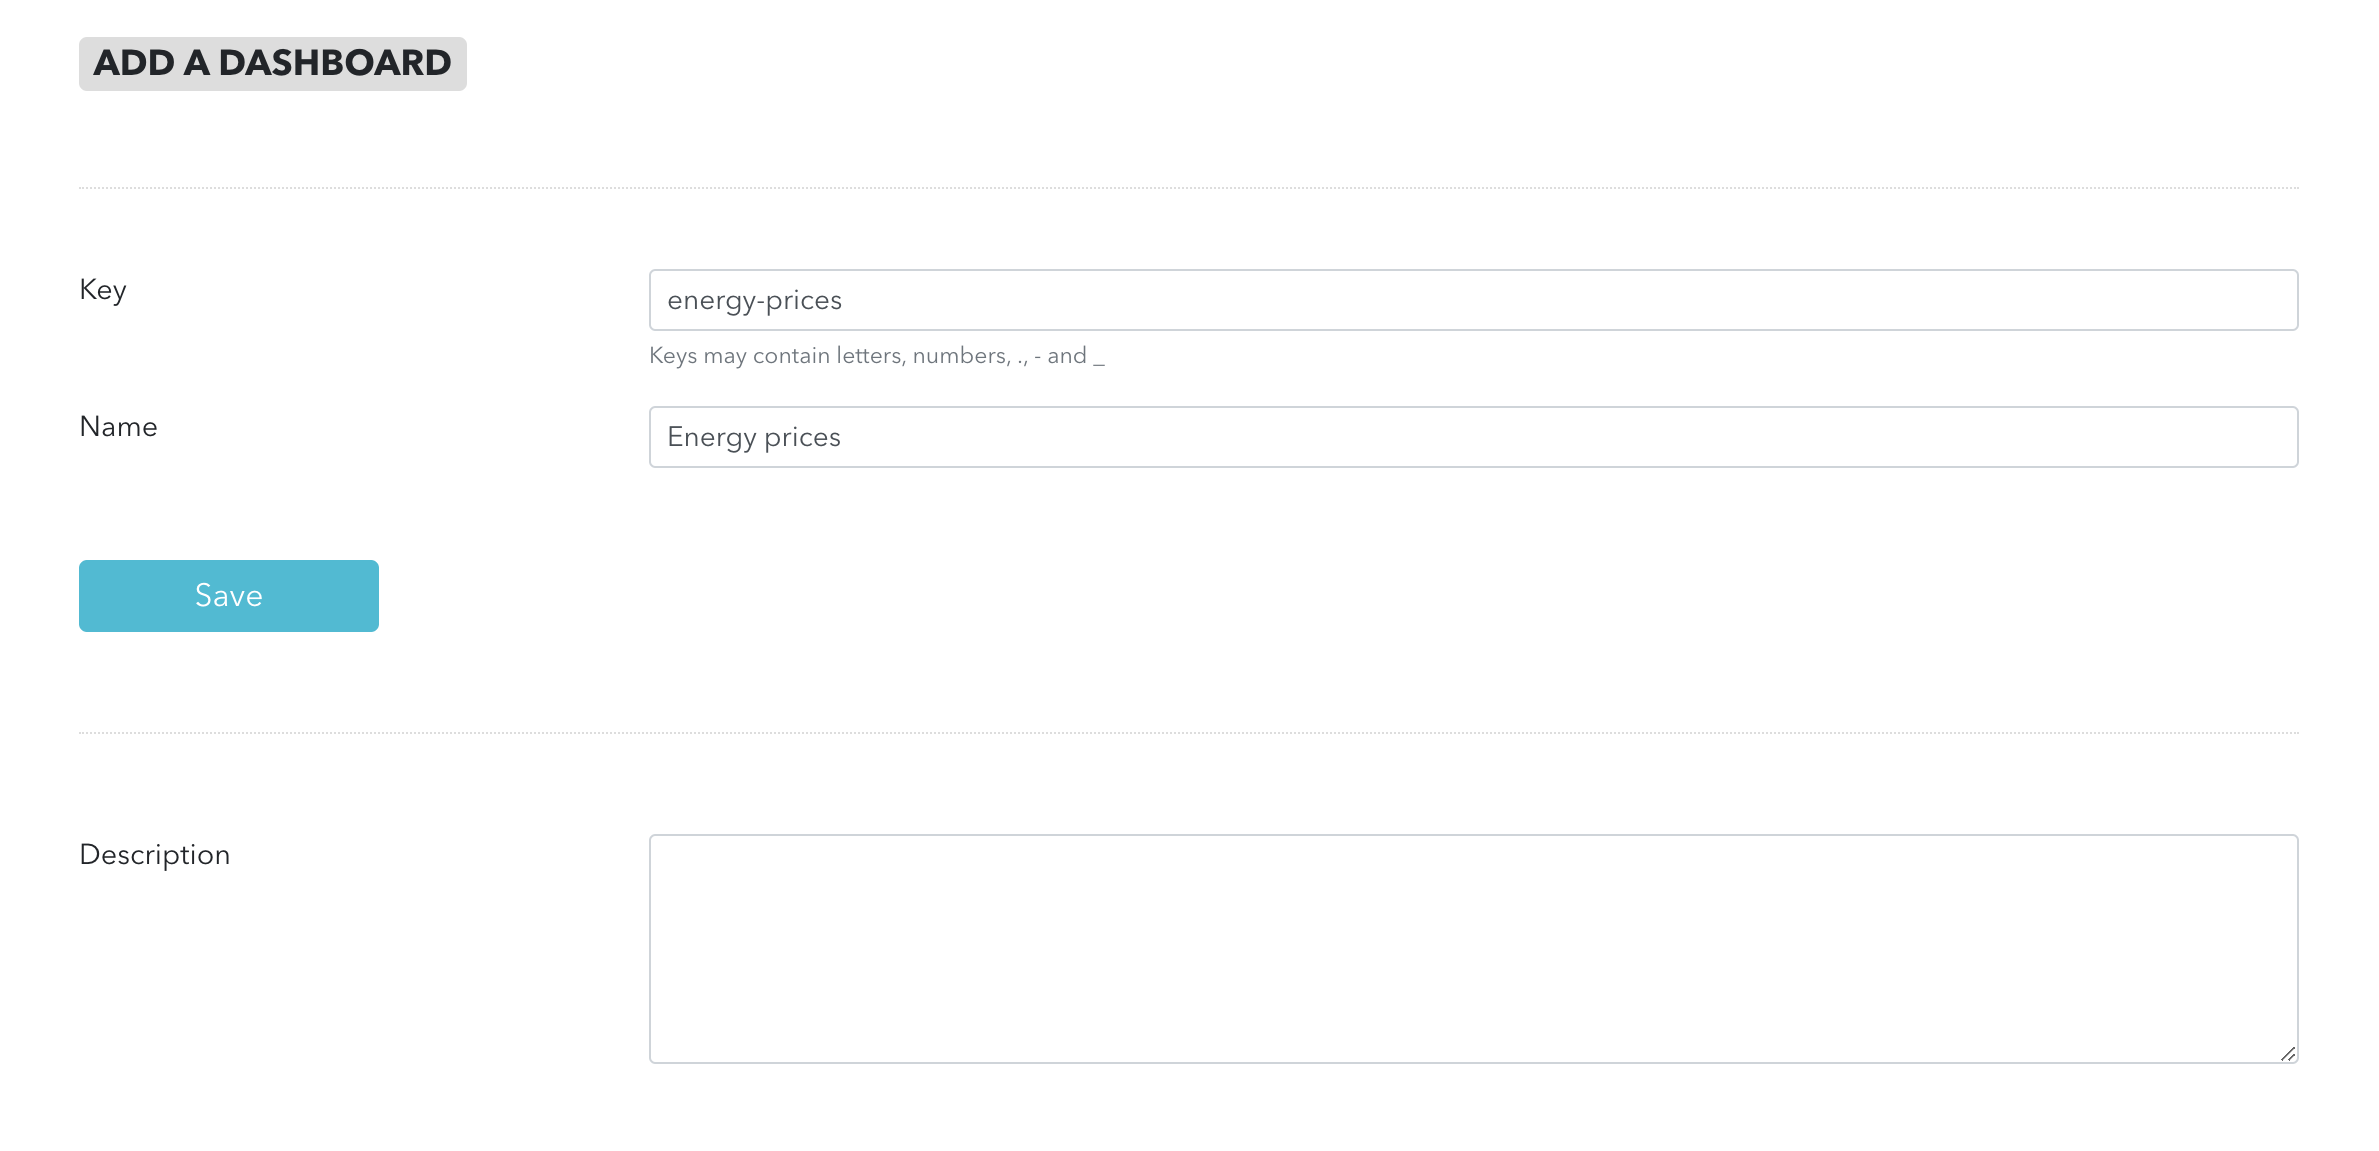
Here we have used "energy-prices" as an identifier and "International energy prices" as a name. You can use the identifiers and names you like.
Click on "Save"
Adding charts
First chart
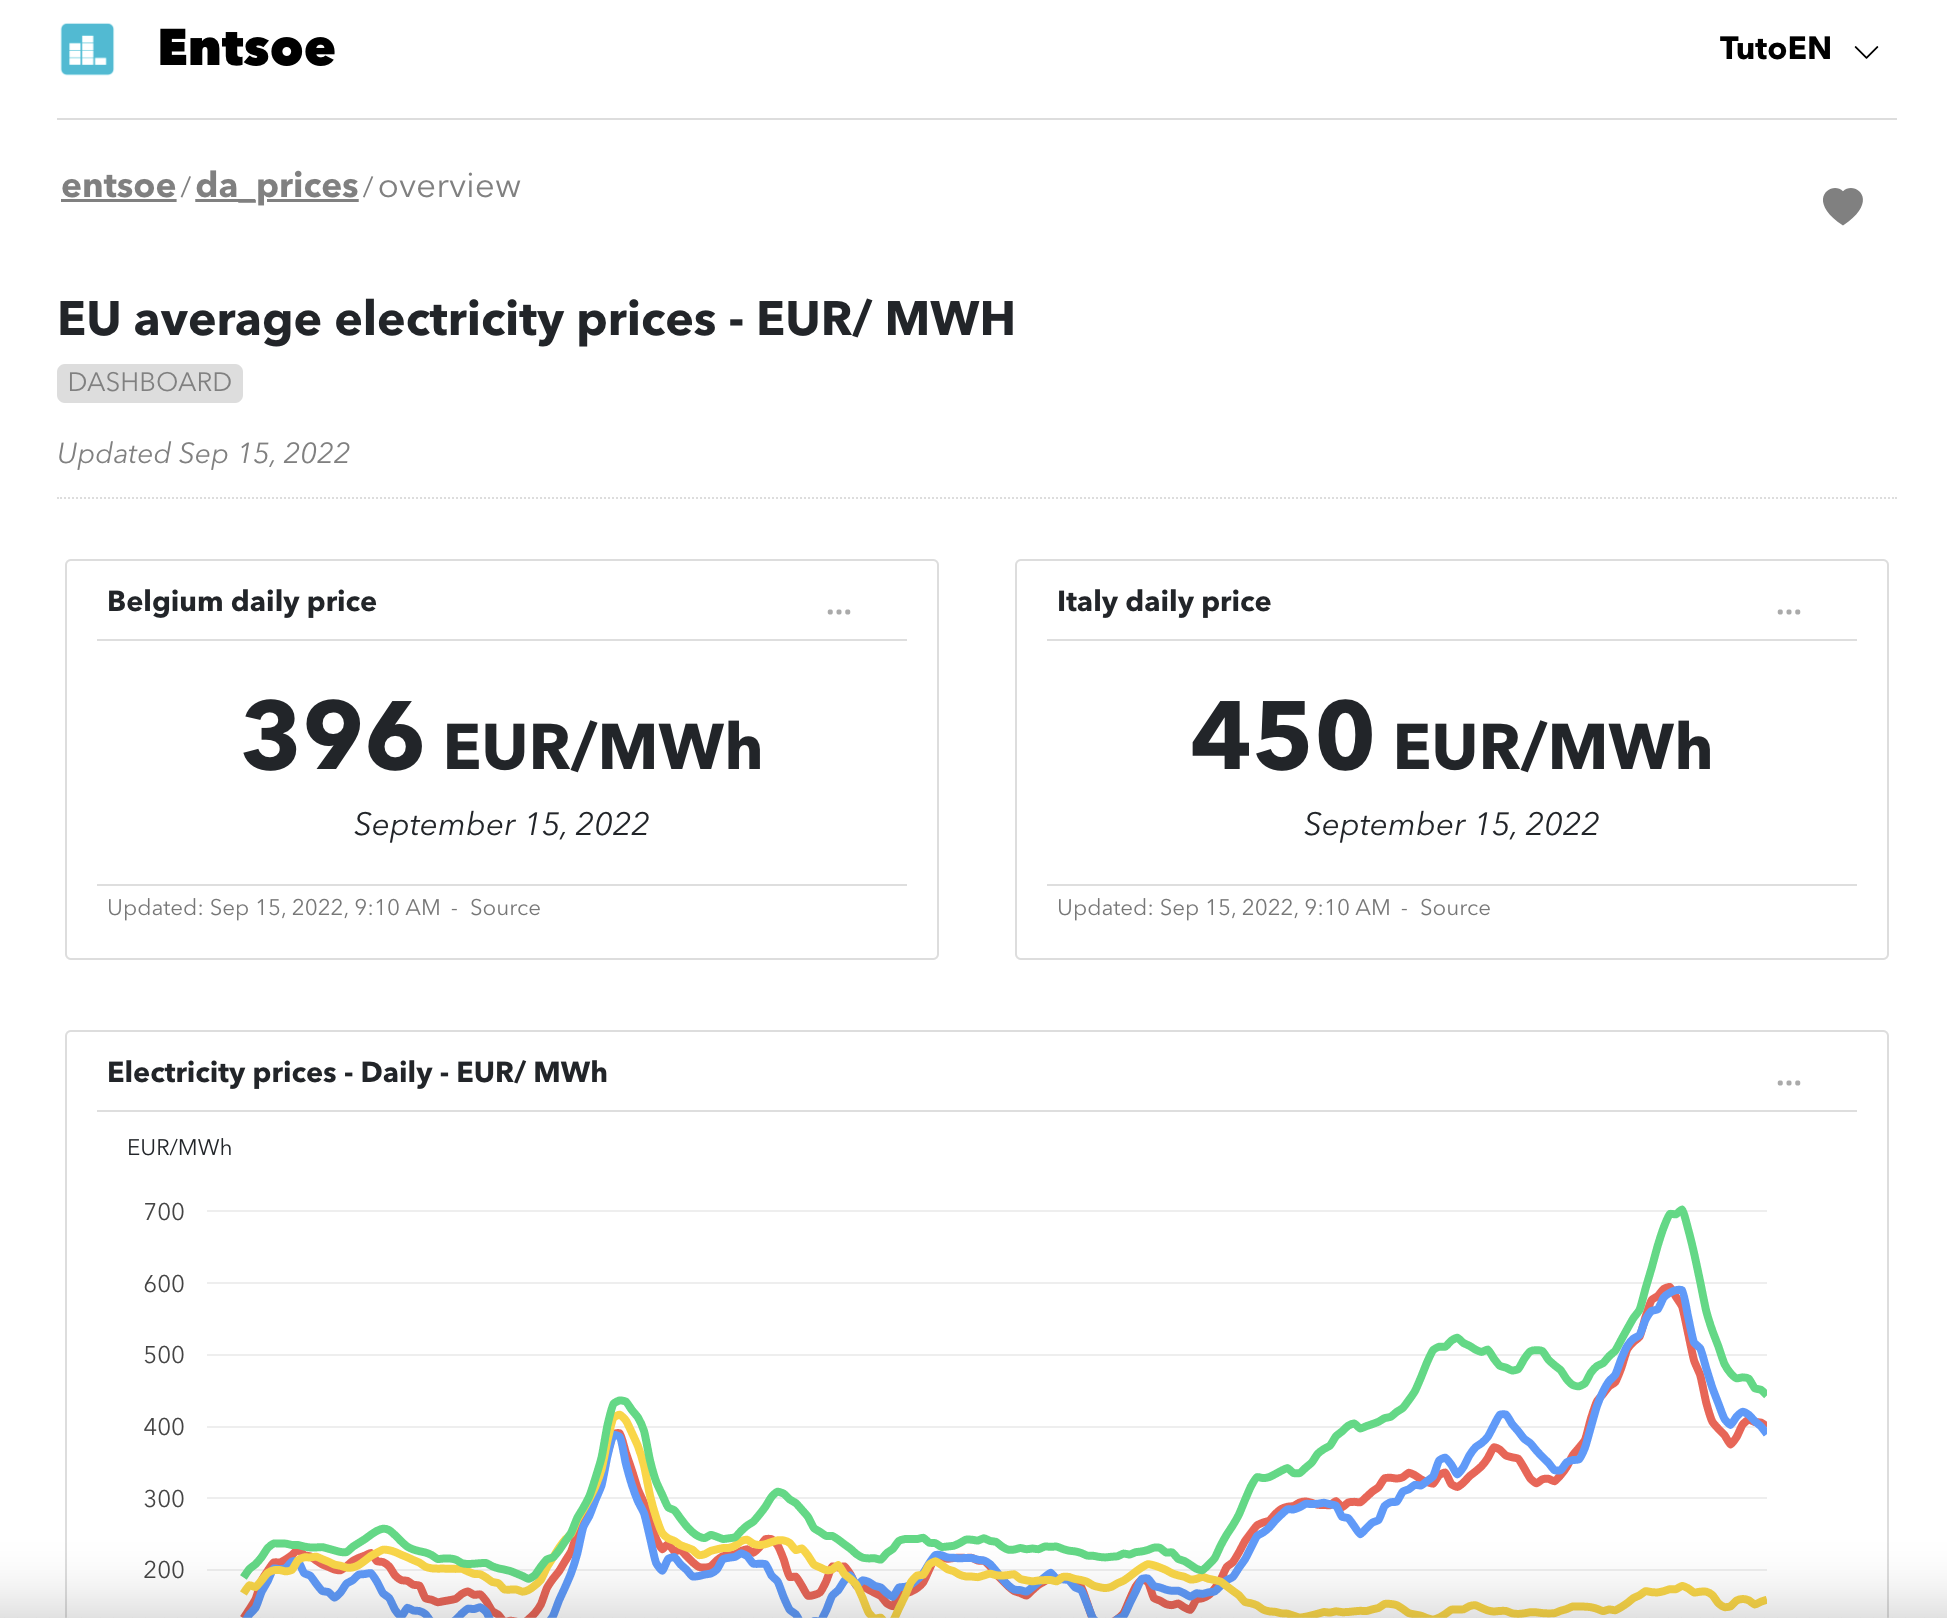
Let's visit first a chart that provides average daily electricity prices across Europe.
This chart is part of an account with data from the association of electricity network operators in Europe. It is here.
On the top right of the line chart with the series, click on the three dots icon. Select "Add to a personal dashboard".
You are now being asked in which dashboard to add the chart. Select the one you have just created.
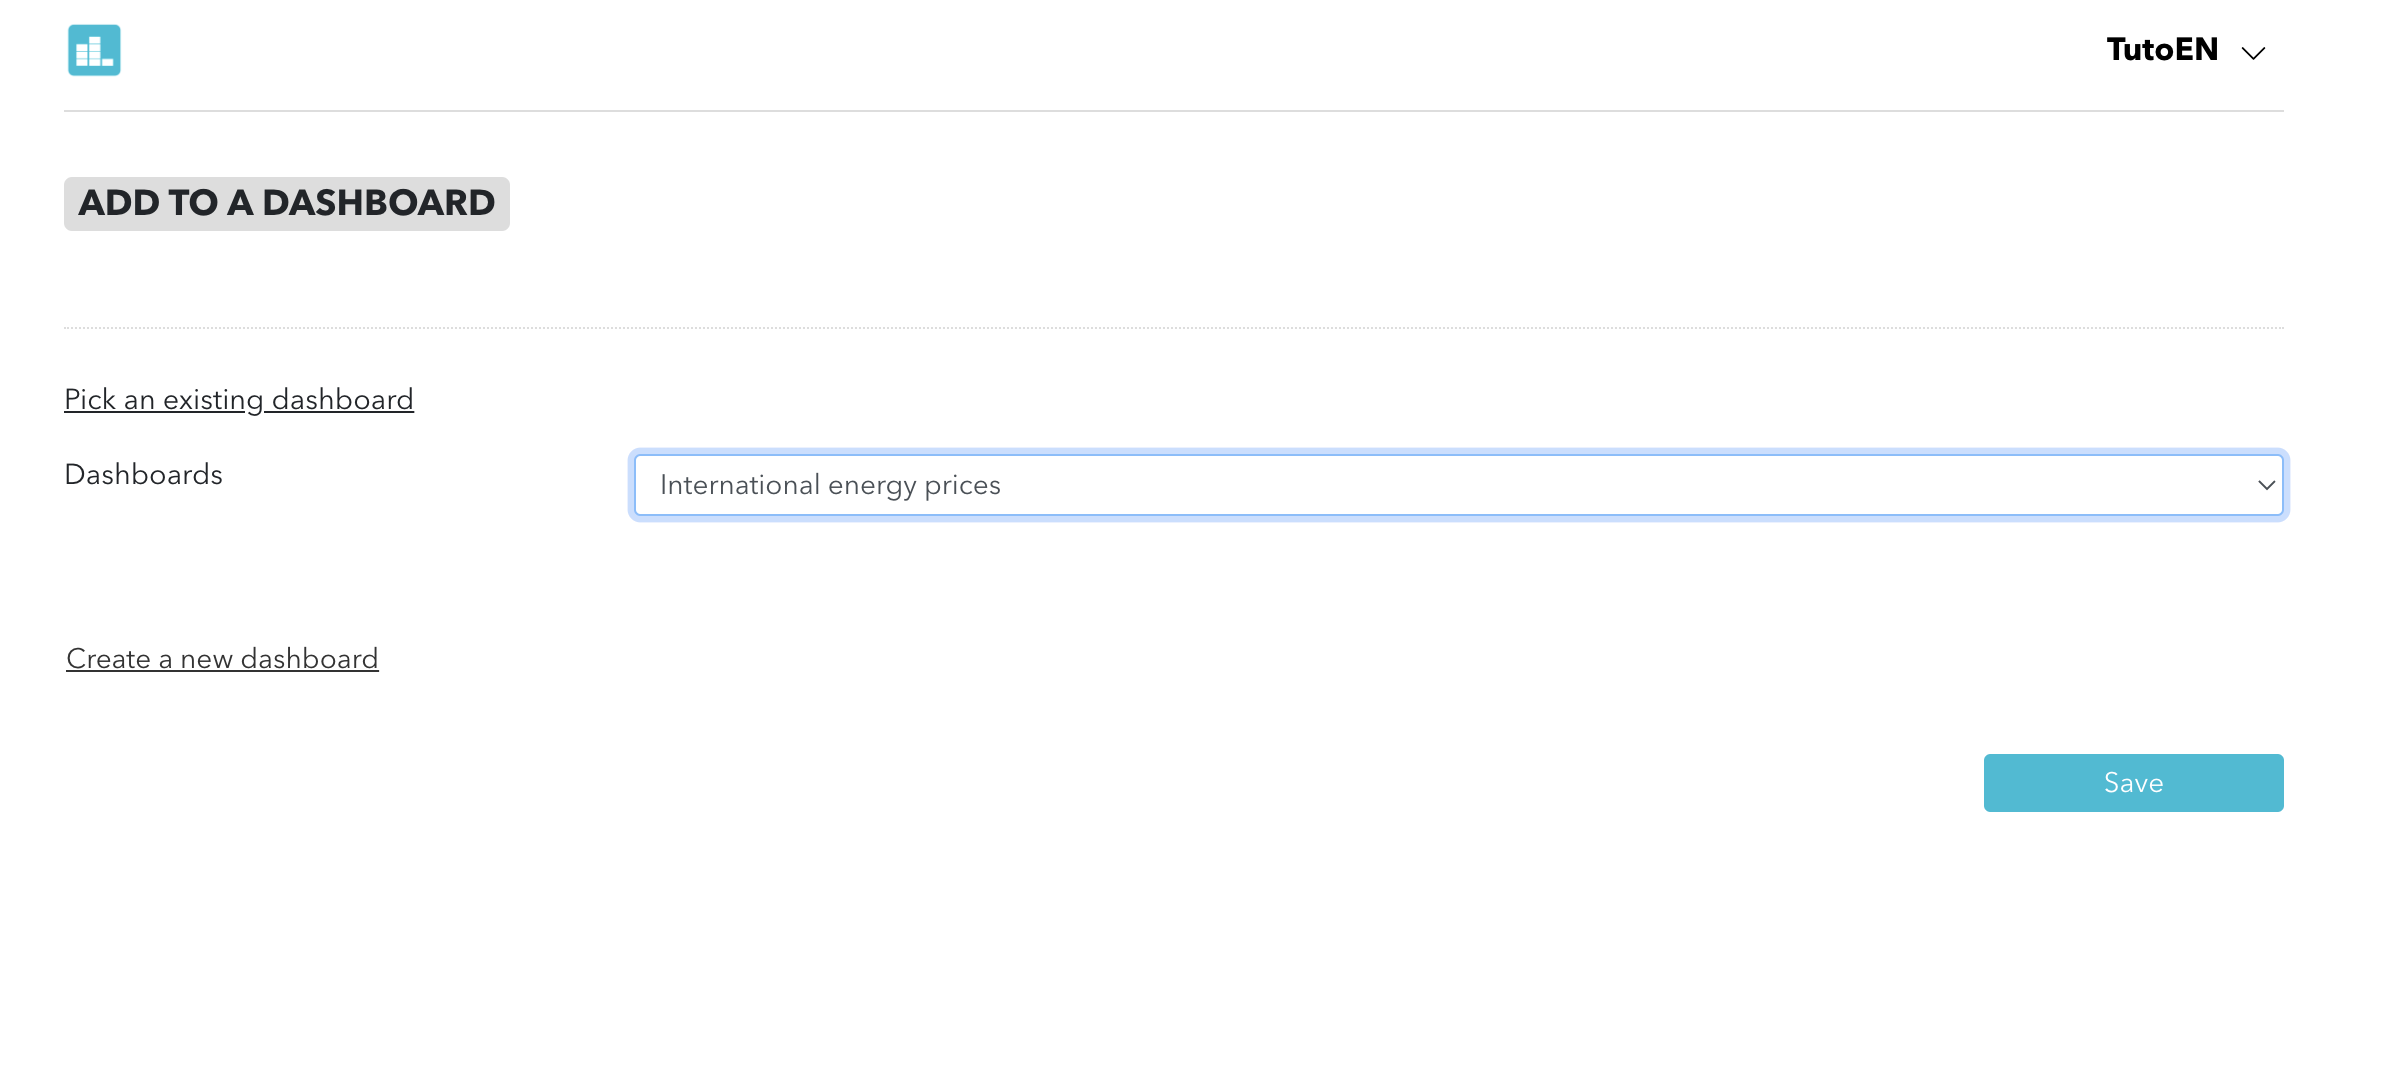
Click on "Save"
Second chart
Let's add now a second chart with oil "futures". Go to this EIA dashboard. Pick the chart with the series.
Repeat the same steps to add this chart to your dashboard.
Adding series
We have added two charts to our dashboard.
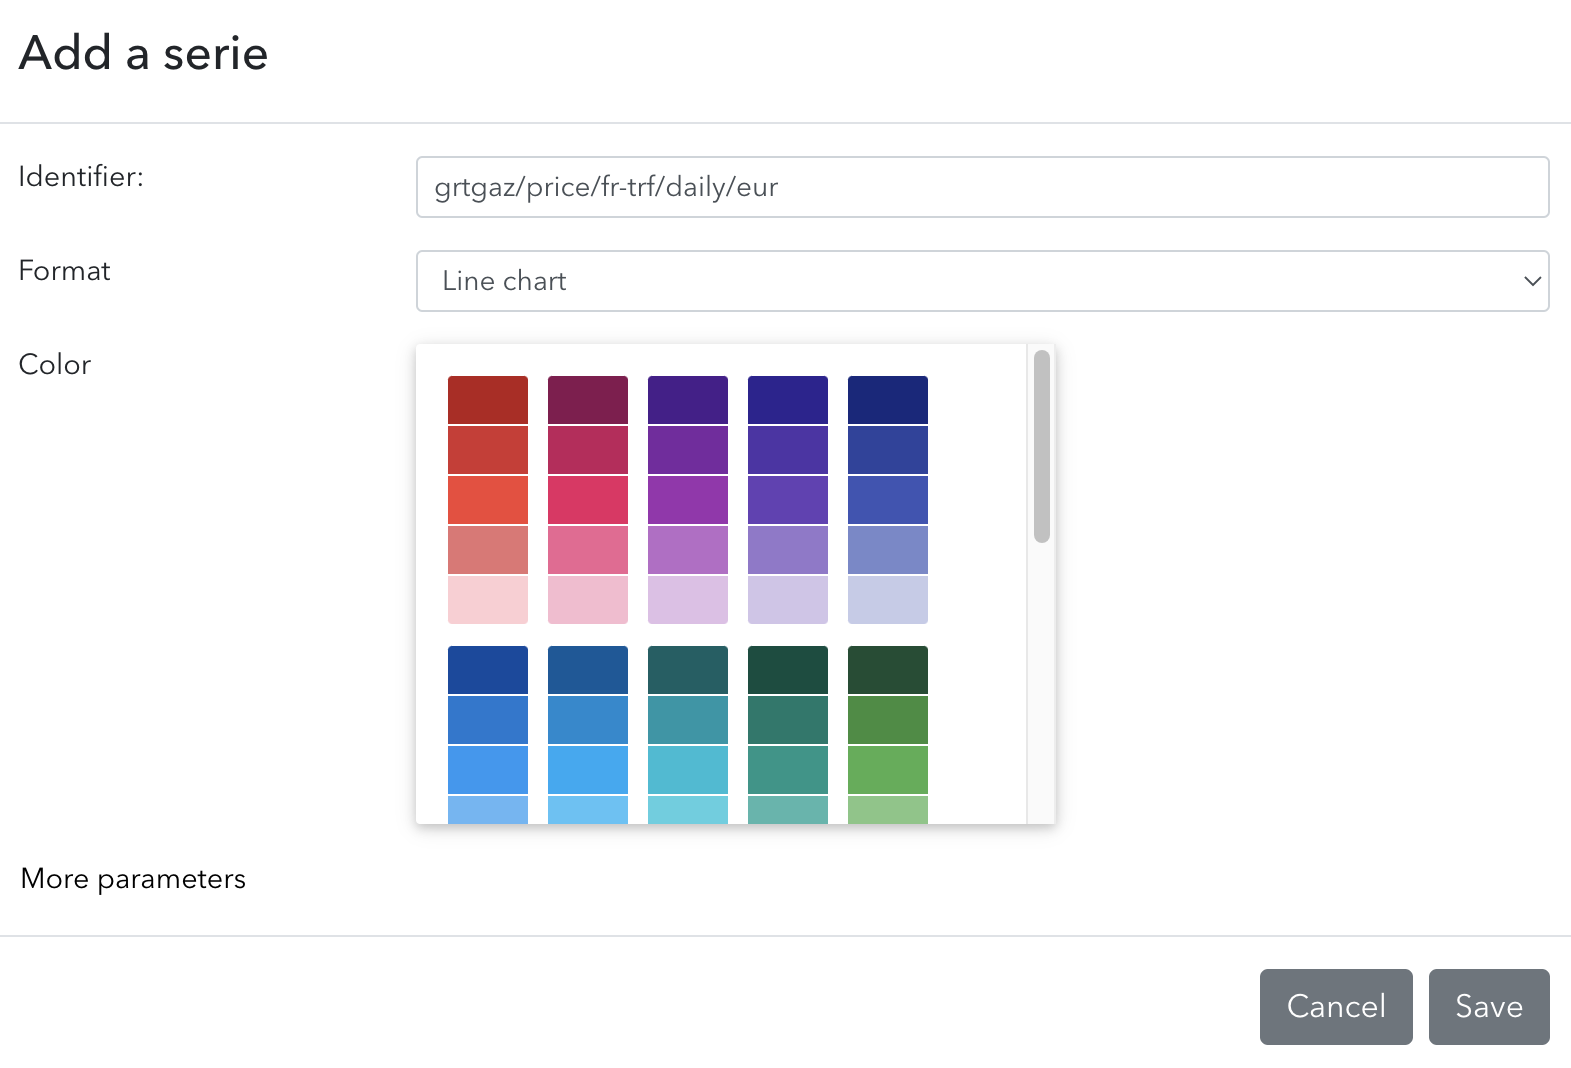
We are now going to add a serie. You can for instance visit French gas prices published by the French network operator.
On the top right, click on the heart and add to a personal dashboard. Select the dashboard, the 'Line chart' format and save.
Changing charts
After adding the serie, you are redirected to your dashboard with the three charts above.
We are going to change the last serie we have added to make it start in 2022. Click on the top right of the chart on "Update chart".
In the field "Name", write 'Natural Gas Prices in EUR/ MWh'. Then, on the section below with series, click on the toggle on the right and choose 'Update'.
In the "Start" cell, write "2022-01-01" to start on the 1st of January 2022. We use this way of writing dates with year, month and days separated with dashes on Statit.
In the "Color" section, pick a different color.
Click on 'Save'.
The dashboard
We have done this to create a dashboard that contains the key metrics we are interested in.
You will find this dashboard in your "Home" on the "Dashboard" tab. The dashboard will always be up to date with the latest values.
You can now create dashboards with series from public collections and private accounts of which you are a member.
If you want to remove the dashboard, start by removing each chart (top right of the chart) and then remove the dashboard.
Next steps
You have now learnt to build your own dashboards and charts.
If you are interested to access series directly in Excel, head over here
If you would like to publish series, head to the publisher guide