Using the website
Your Account
If you already have an account, you can already go to the Favorites and Alerts section.
Otherwise, to create an account, follow the instructions below.
Creating the account
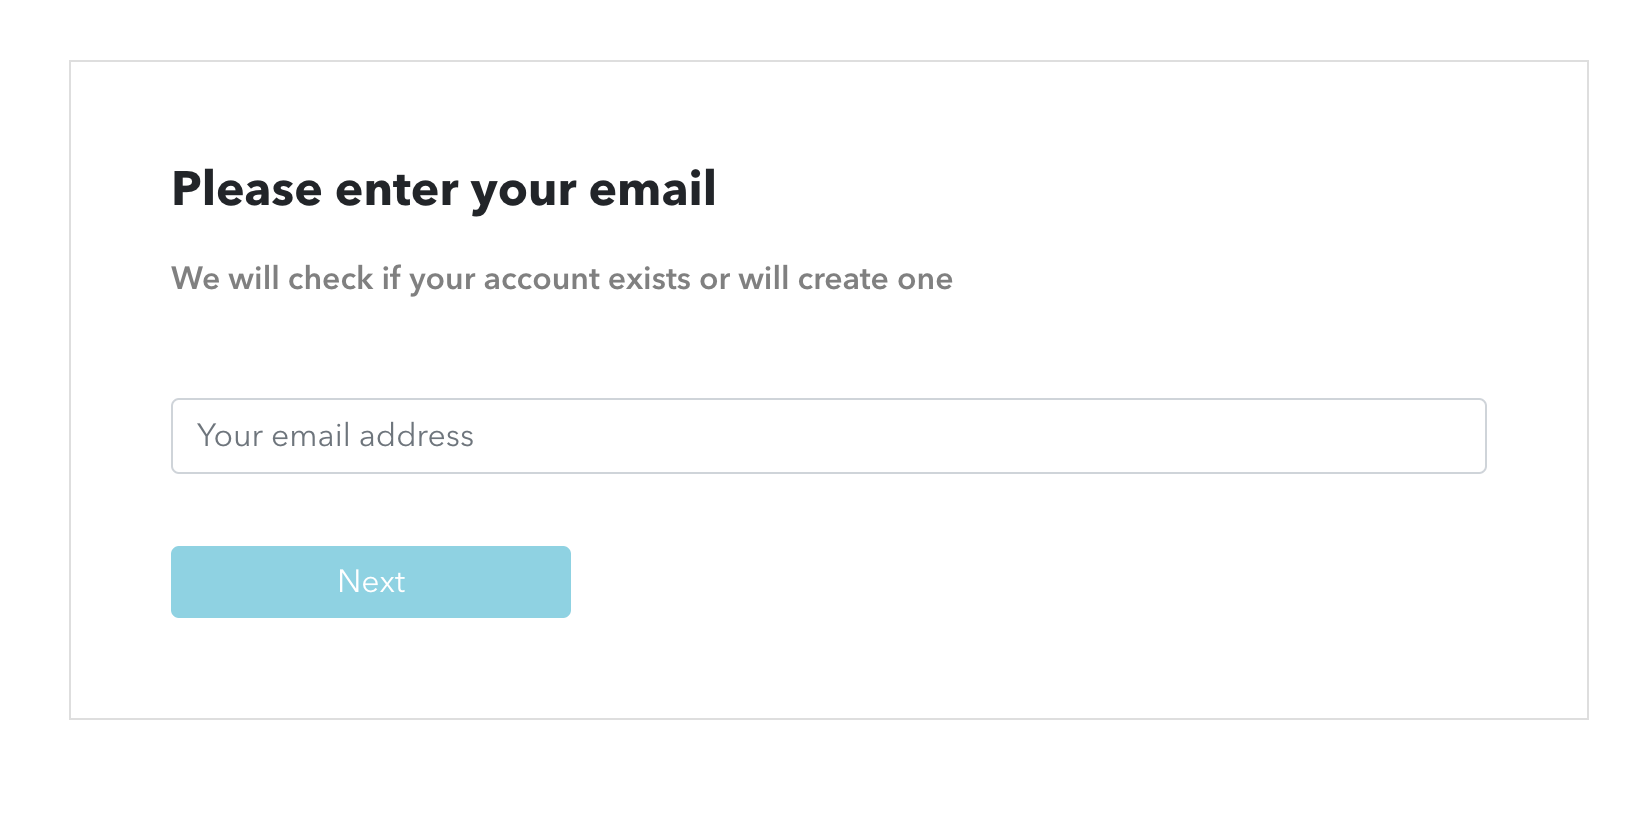
Go to sign-up page, enter your email and click on 'Next'.
On the next screen, we will ask you the type of account you want to create, a username and a password.
There are two types of accounts:
- 'User' accounts allow you to access public and private series
- 'Publisher' accounts allow you to publish series and share them with collaborators
You can start with a 'User' account and later transform it into a 'Publisher' account. For now, choose a 'User' account.
The username will represent the account. If the account is only for you, pick a username that represents you individually. If the account is meant to become a 'Publisher' account used by a group, pick a meaningful username.
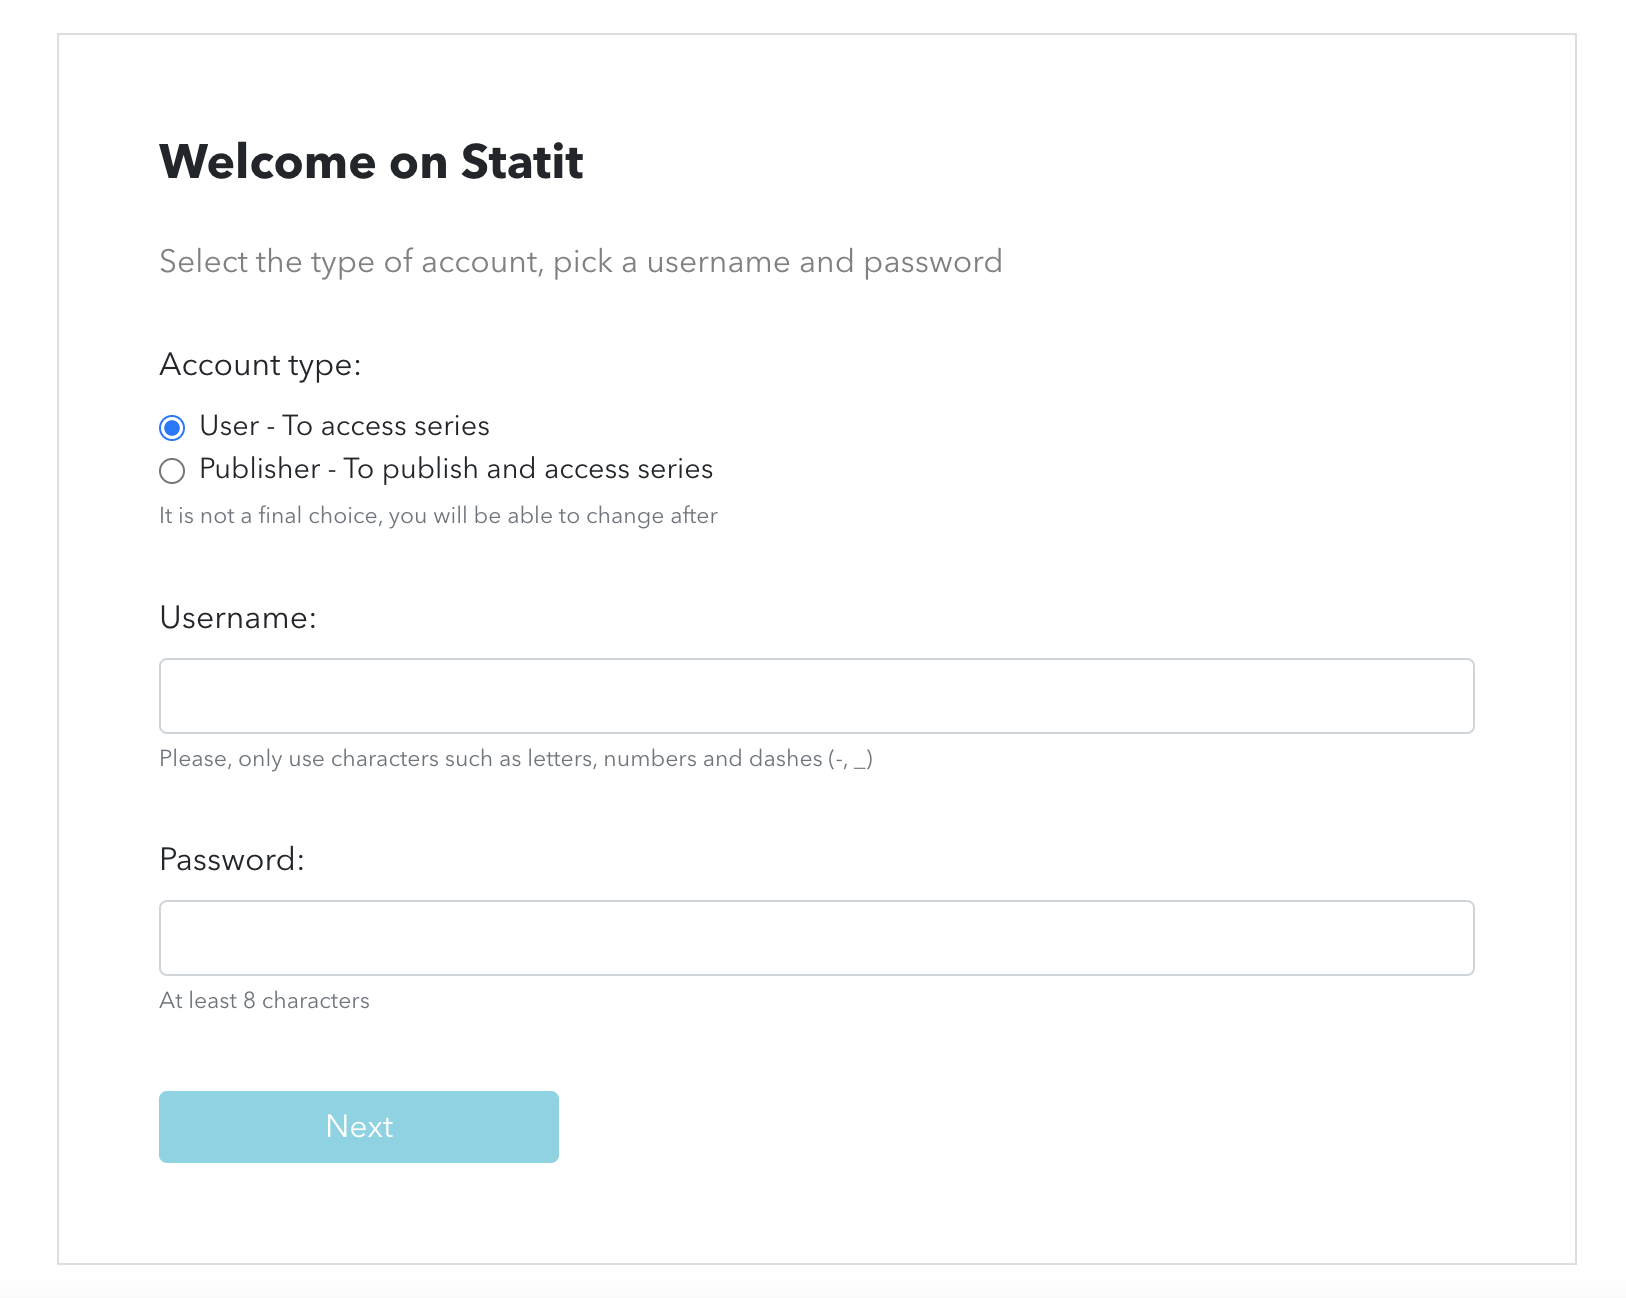
Click on 'Next'. Your account is going to be created.
Home page
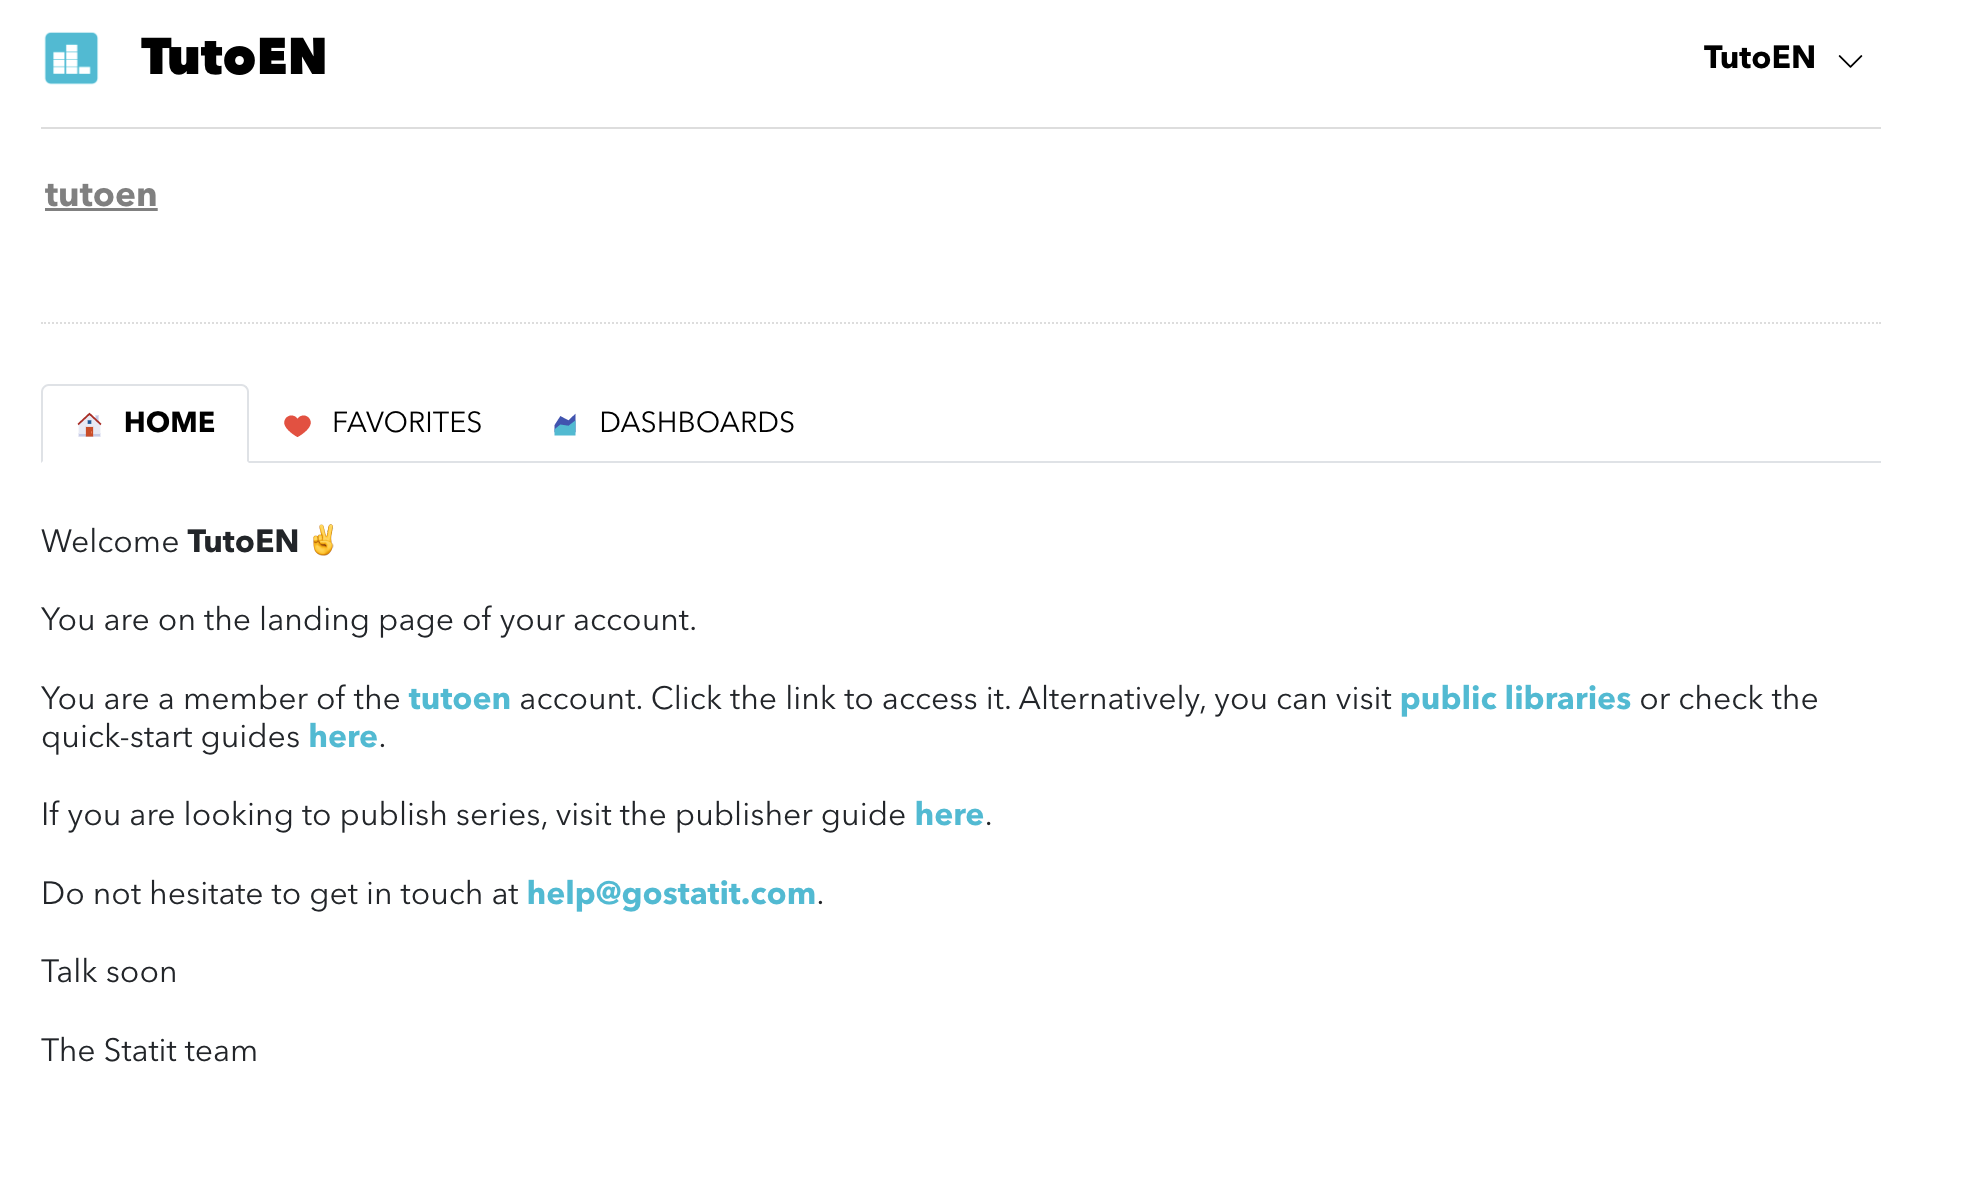
After signing-up, you arrive on the home page with three tabs:
- Home - welcome page
- Favorites - personal favorites and alerts créés
- Dashboards - tableaux personnels
In our case, we have created an account with the username "TutoEN".
Personal information
On the top right of the page, click on your username.
The menu allows you to go back to the home page, to access the user guide and to configure your account ("My account").
If you have been invited to another account by a collaborator, you will find a link in this menu.
Click on "My account" for you personal information. You can complete your name, a description of your account and add a profile picture.
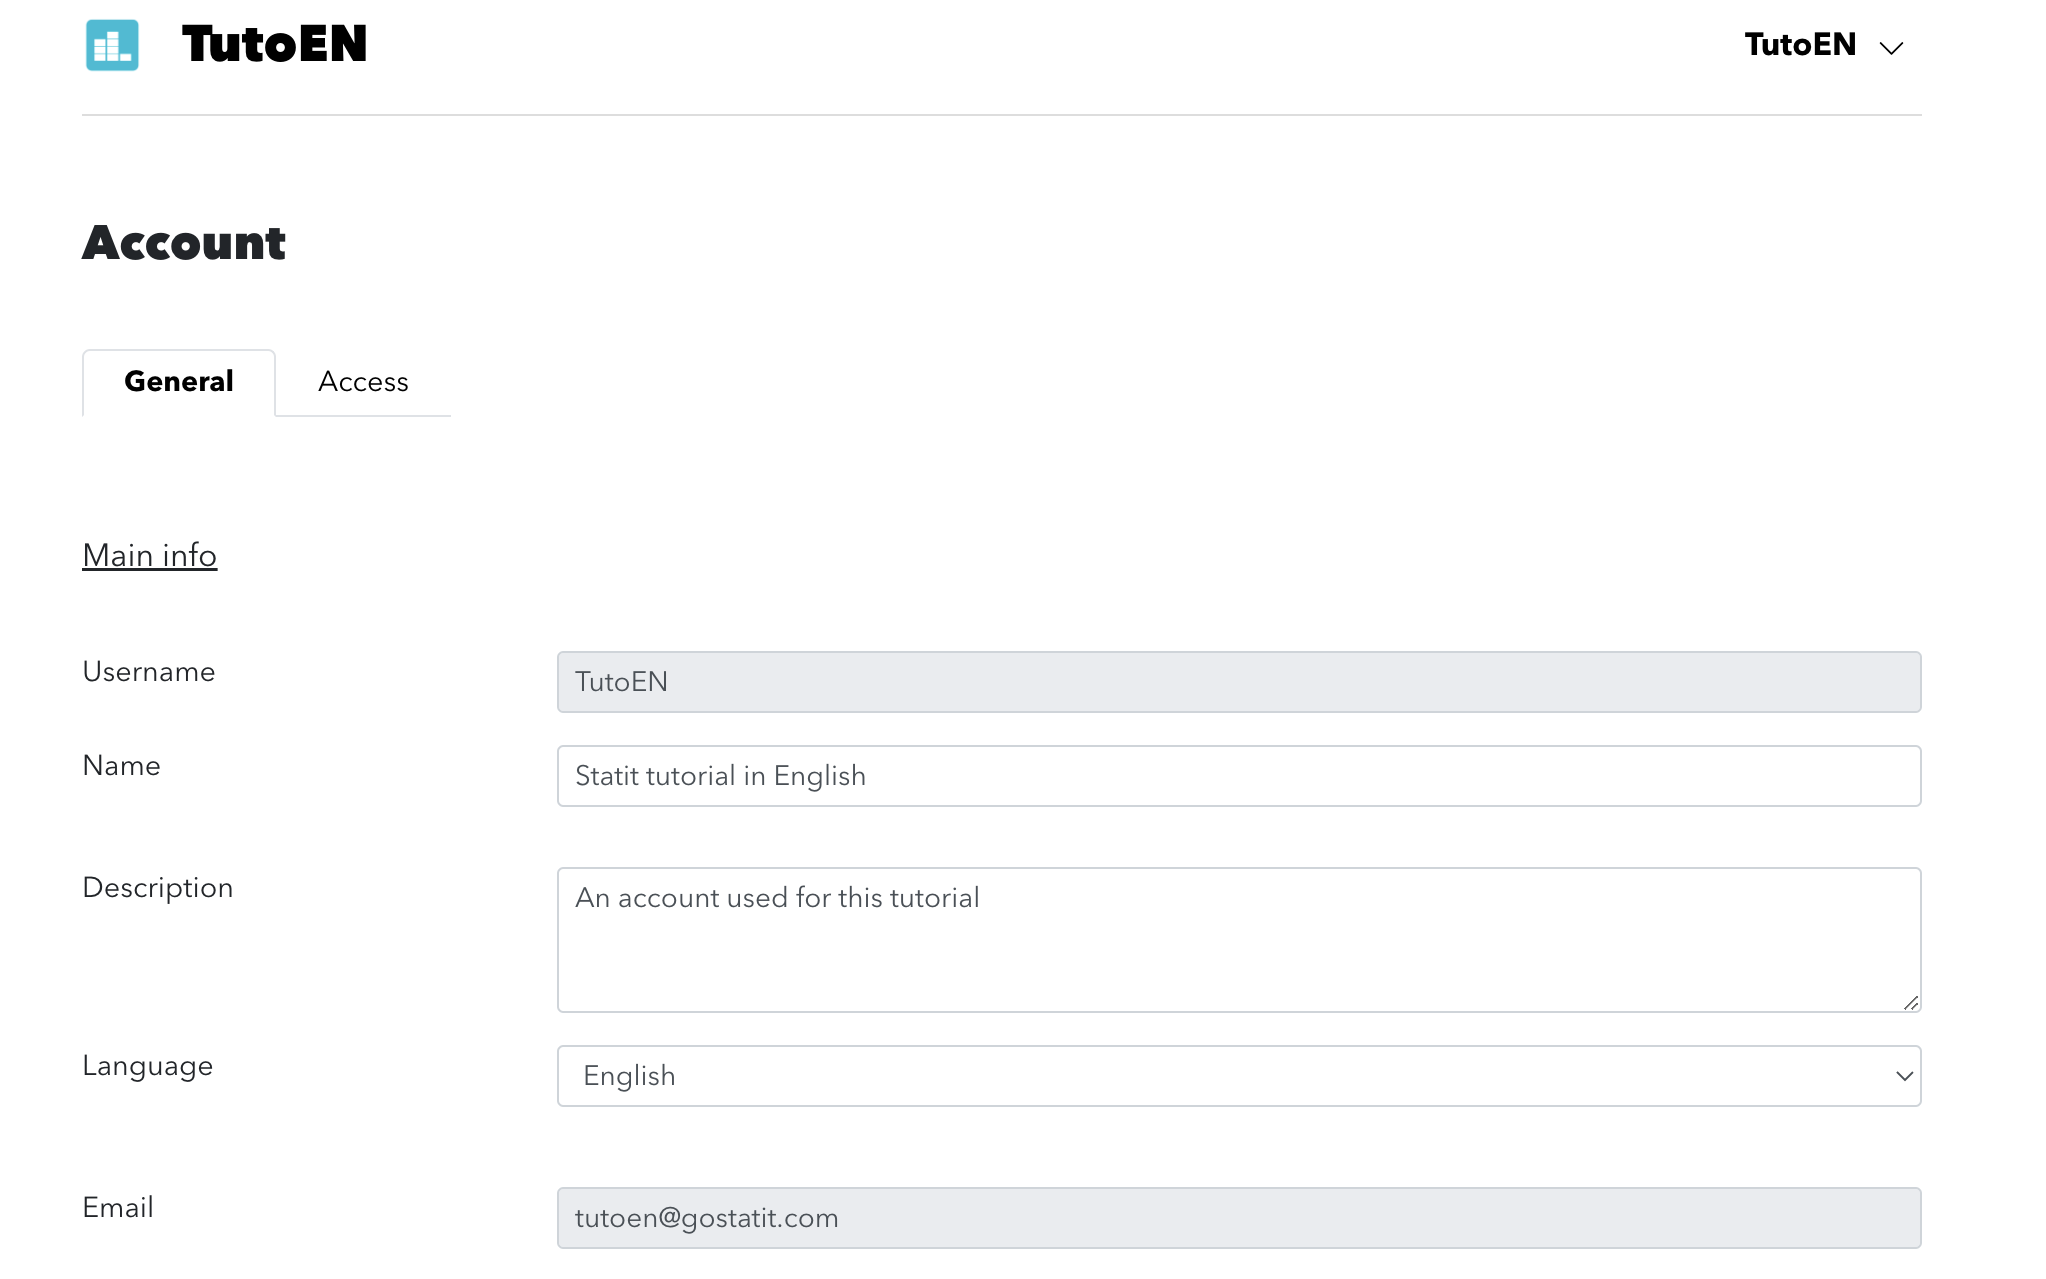
You can as well change the default language for the account and delete your account.
We will get back on the other sections later.
Your Favourites and Alerts
Statit allows you to save the series or collections you need to help you find them easily.
Following a collection
To get started, we are going to follow a collection.
Head to the Pink sheet collection. This is a public collection redistributing international commodity prices compiled by the World Bank.
On the top right of the page, you can see the 🖤 icon. Three options are possible:
- No alert - you will not receive an alert for this collection
- Alert on update - vous will receive an alert by email as soon as the collection is updated
- Alert once a week - you will receive an alert once a week on Thursday if the collection has been updated the previous week
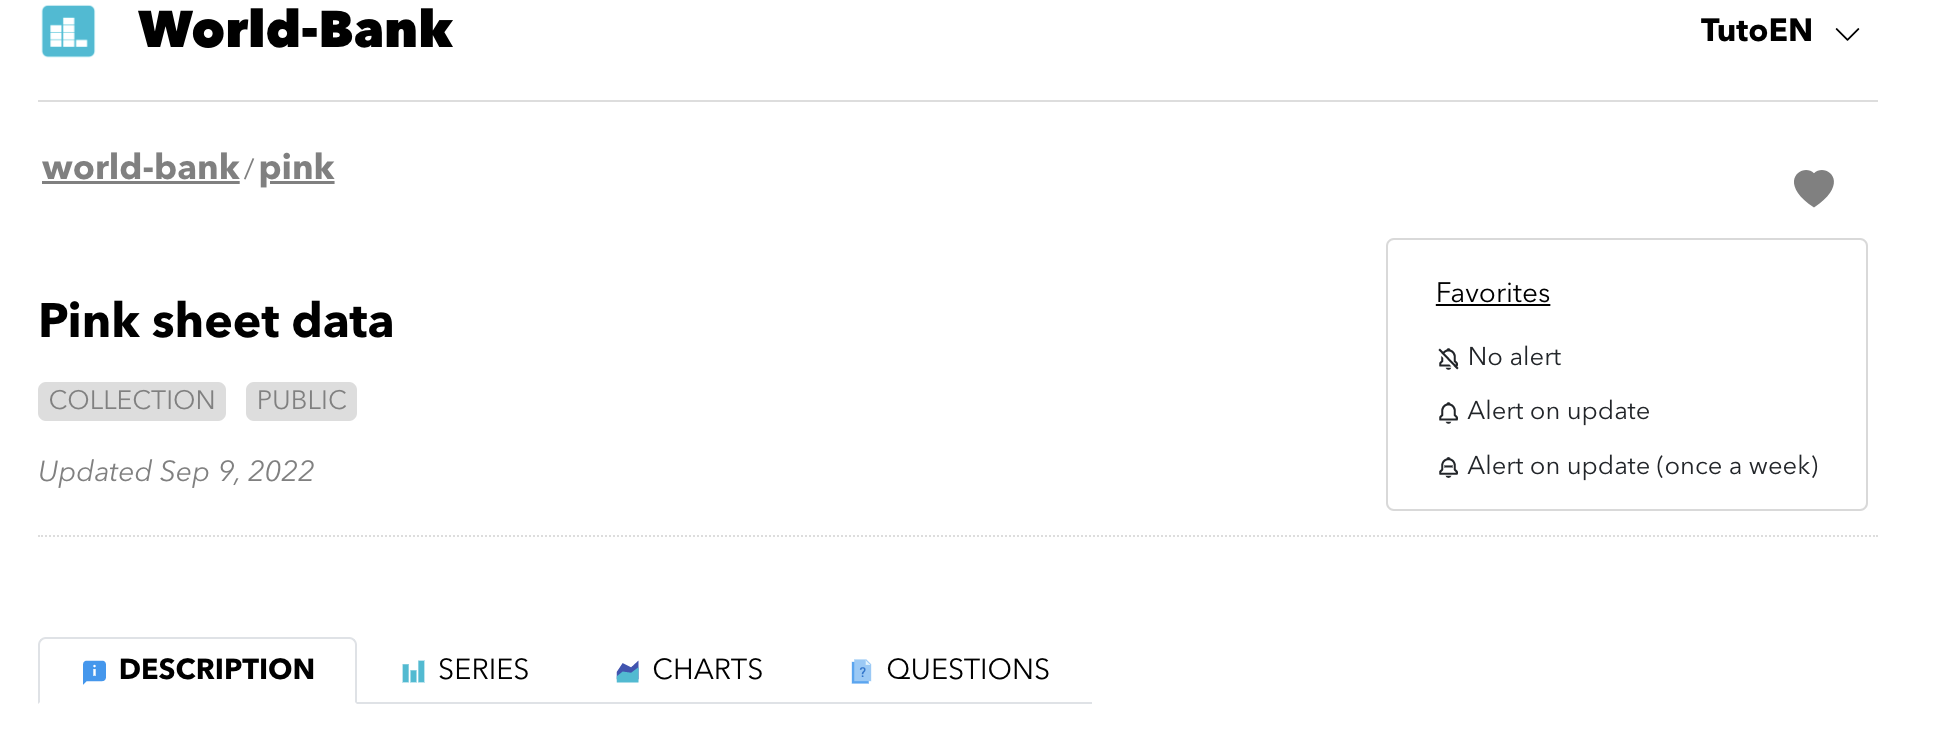
Click on one of the options. You are now following the collection.
Following a serie
Go now on international orange prices by the World Bank.
On the top right, you will find the 🖤 icon. There are two more lines:
-
The first one is "Alert on update (with threshold)". This allows you to set an additional alert criteria. You will be alerted only if the last value of the serie meets the criteria you set.
-
The second is "Add to a personal dashboard". We will cover this in the next section.
Click on "Alert on update". We will change this a bit later.
Access and change favorites
You have now created two favorites.
Go back to your home page to access them. Click on your username on the top right and choose "Home".
Click then on "Favorites" to see your favorites.
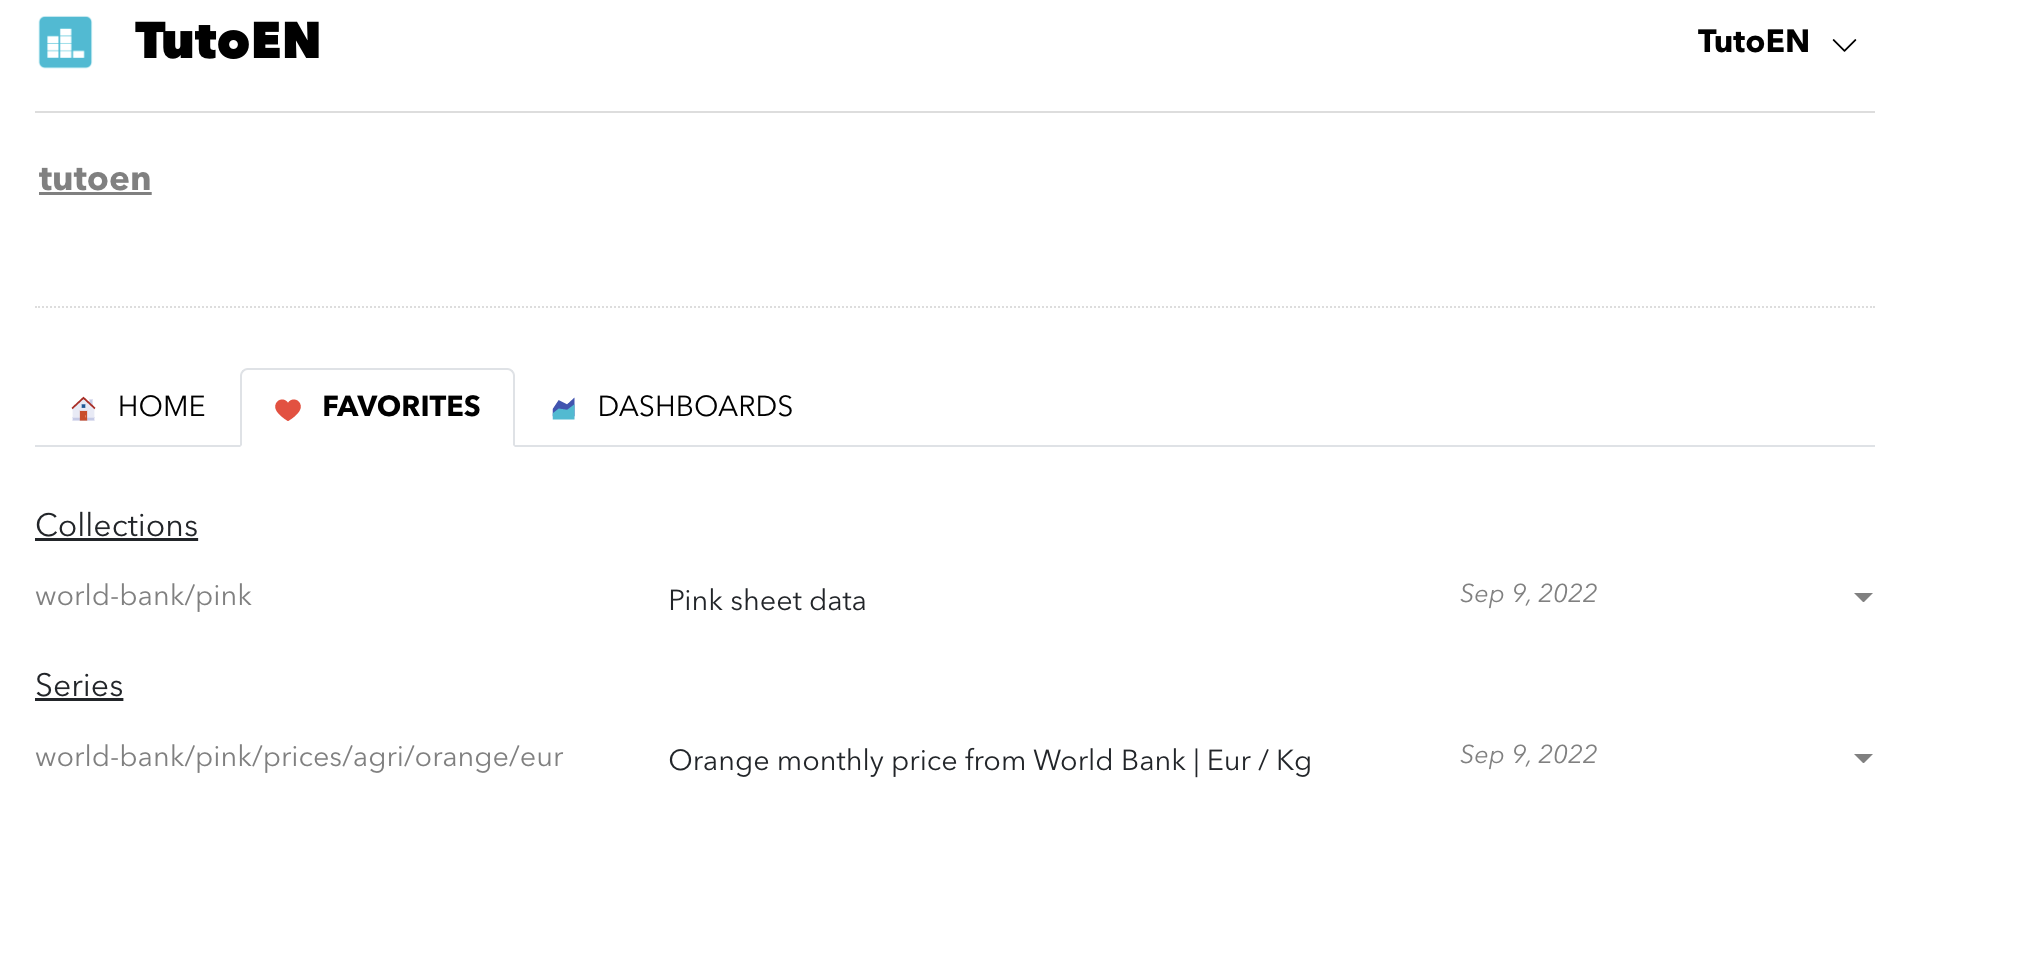
If you want to update the alert or remove it, click on the toggle on the right of each favorite.
Following a dashboard
Finally, it is possible to follow a dashboard.
Go to the dashboard with commodity price indices from the World Bank.
On the top right, you can click on the 🖤 icon in the same way as with collections and series.
Your Dashboards
To monitor even more closely the series you are interested in, Statit allows you to pull them together in your own dashboards.
Creating the dashboard
To start, we are going to create a personal dashboard.
Our goal is to create a dashboard to monitor various energy prices internationally.
Go on the home page of your account by clicking on "Home" in the menu on the top right of the page.
Click on the "Dashboard" tab, then on the button "Create a dashboard" just under.
You are reaching the following screen. You are now going to give an identifier and a name to your dashboard.
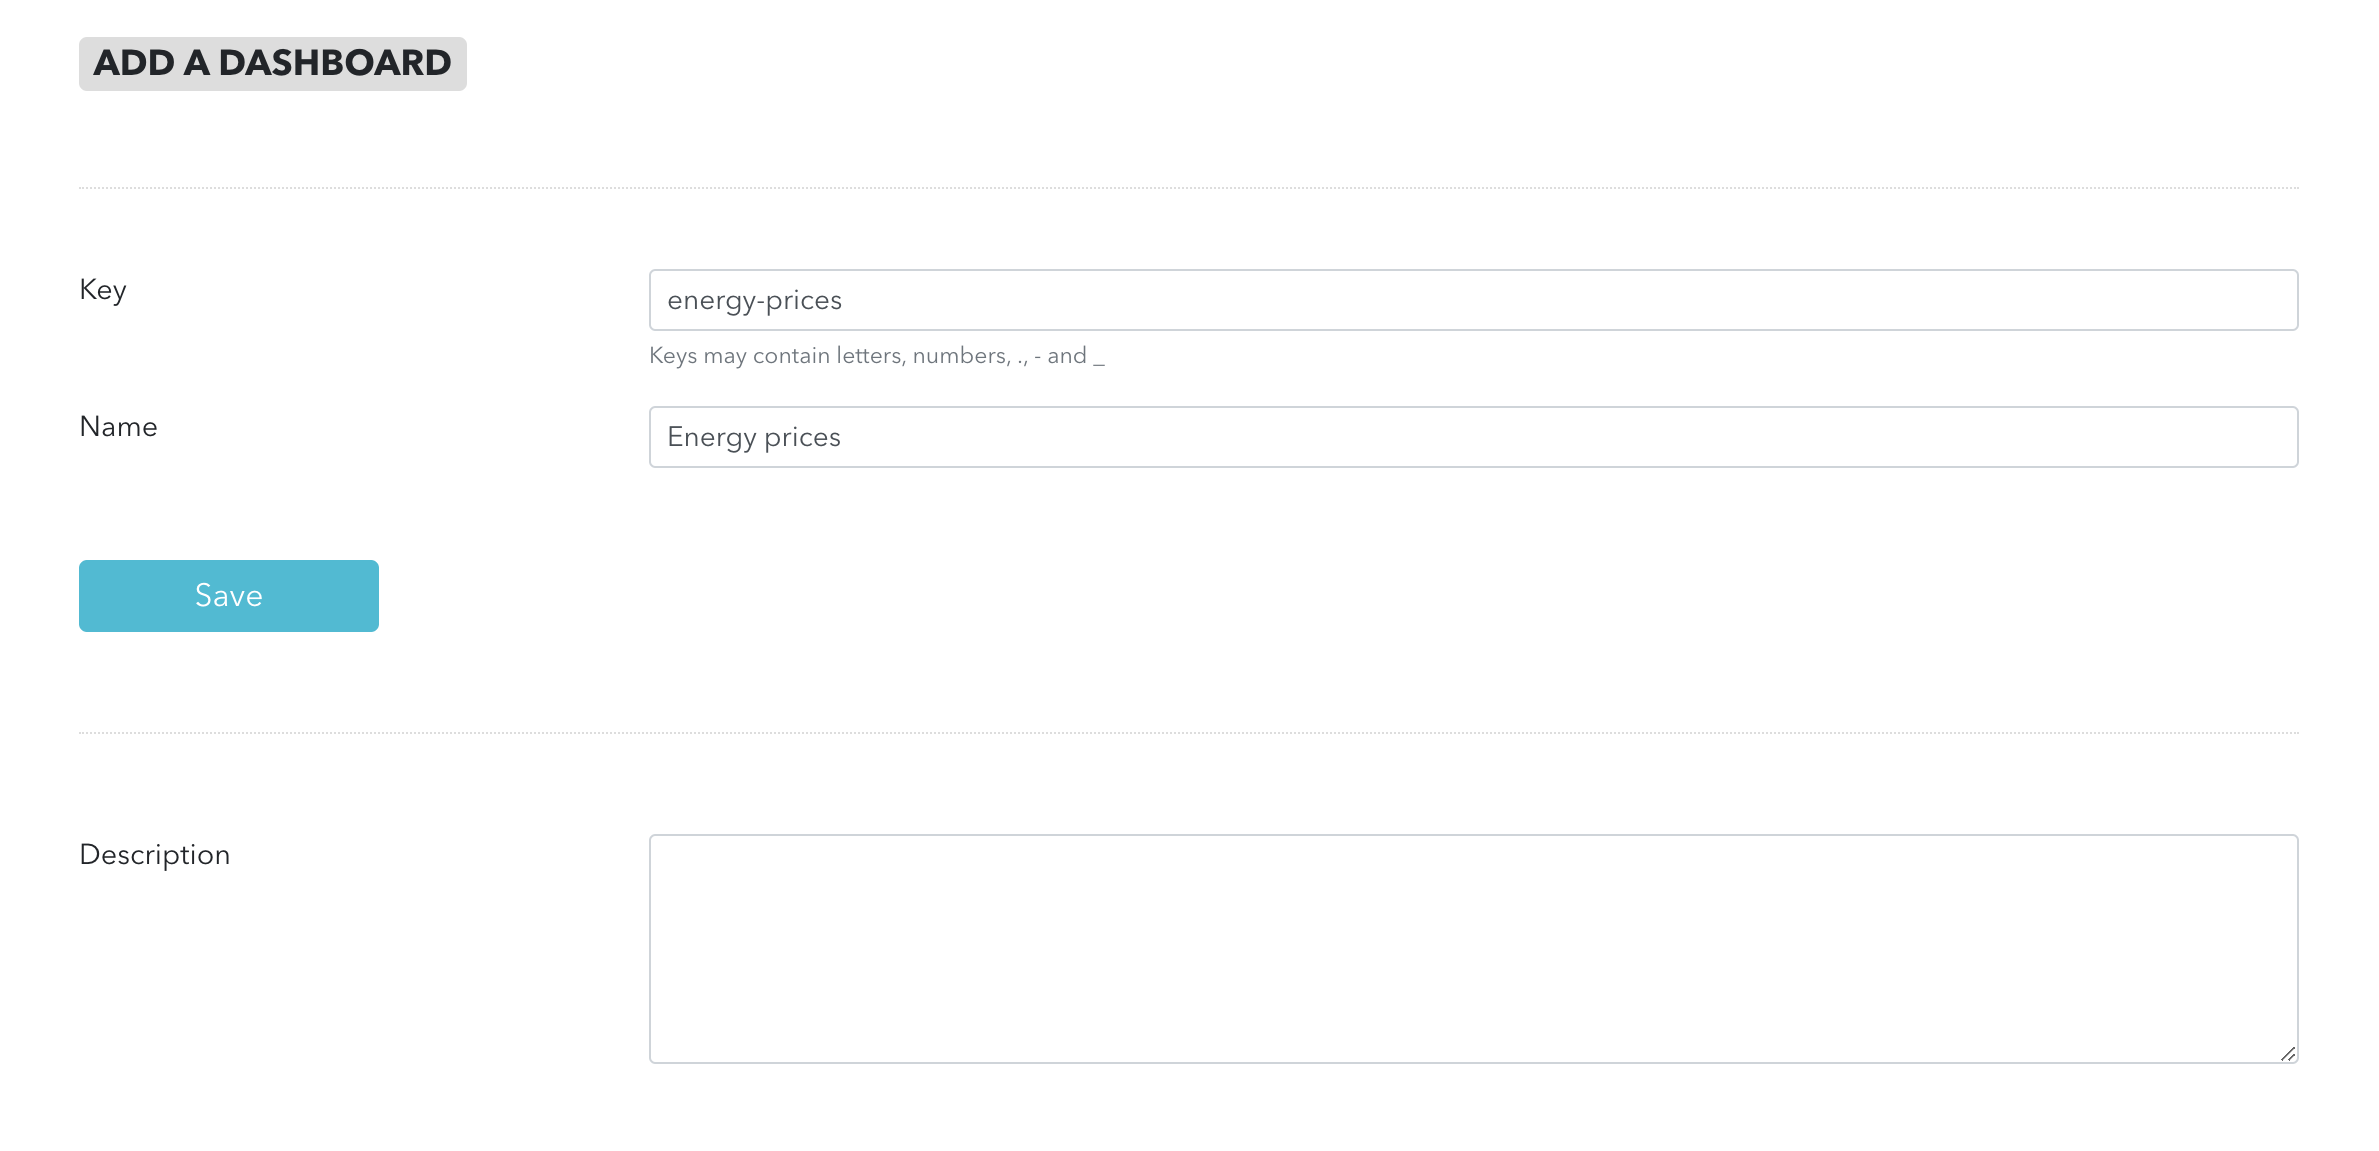
Here we have used "energy-prices" as an identifier and "International energy prices" as a name. You can use the identifiers and names you like.
Click on "Save"
Adding charts
First chart
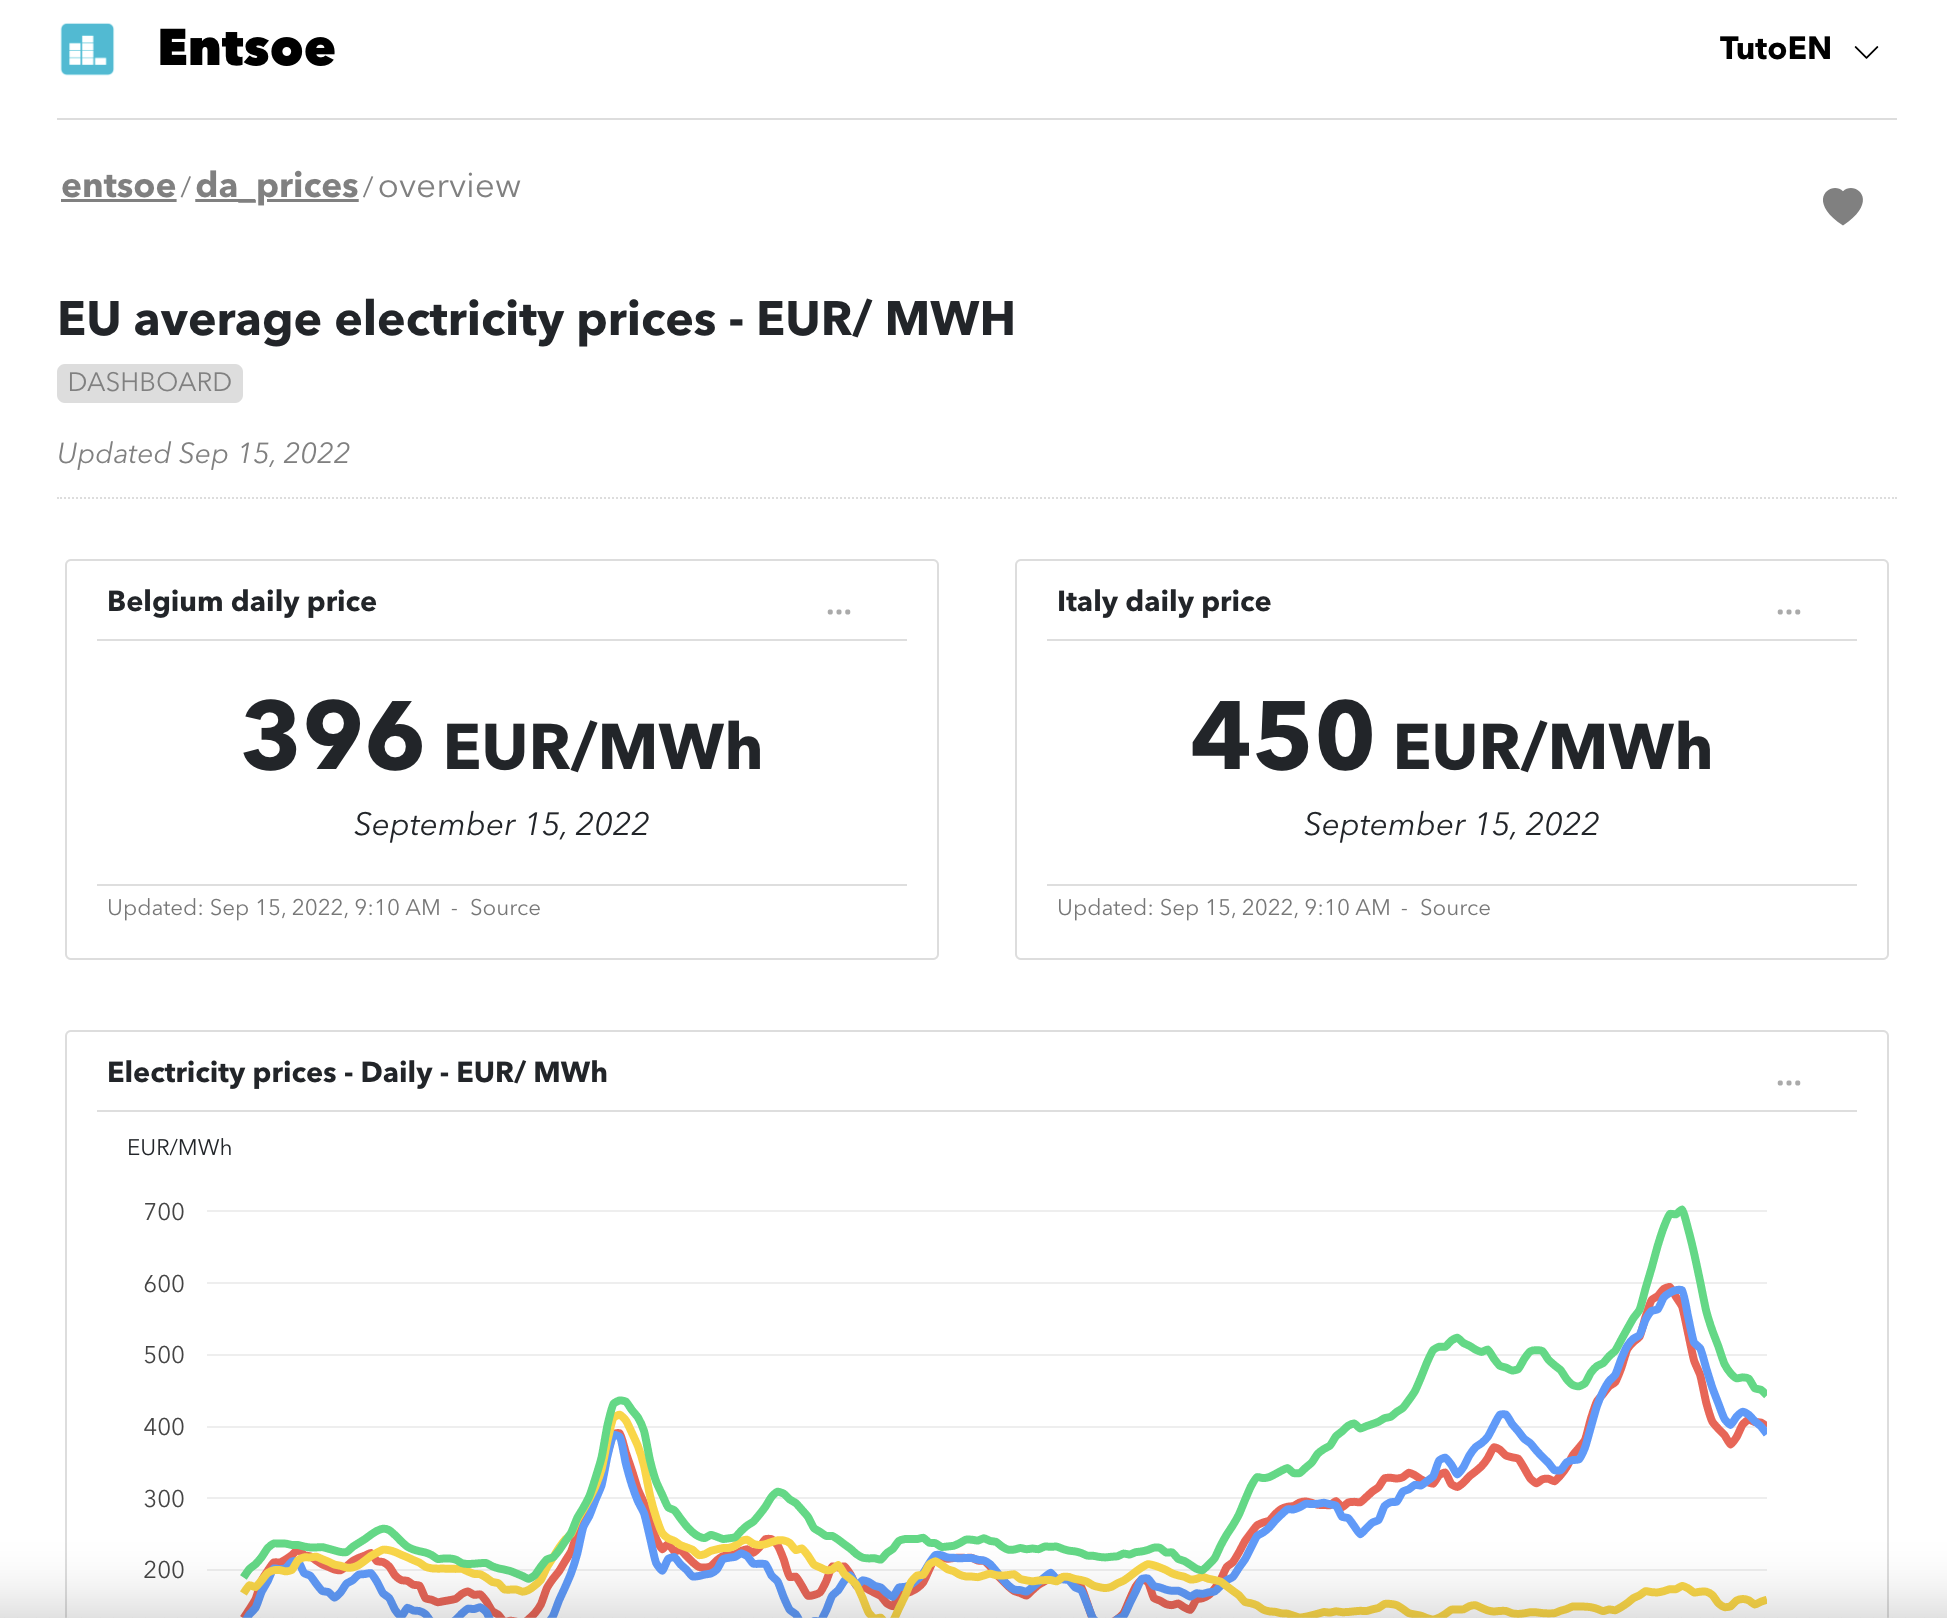
Let's visit first a chart that provides average daily electricity prices across Europe.
This chart is part of an account with data from the association of electricity network operators in Europe. It is here.
On the top right of the line chart with the series, click on the three dots icon. Select "Add to a personal dashboard".
You are now being asked in which dashboard to add the chart. Select the one you have just created.
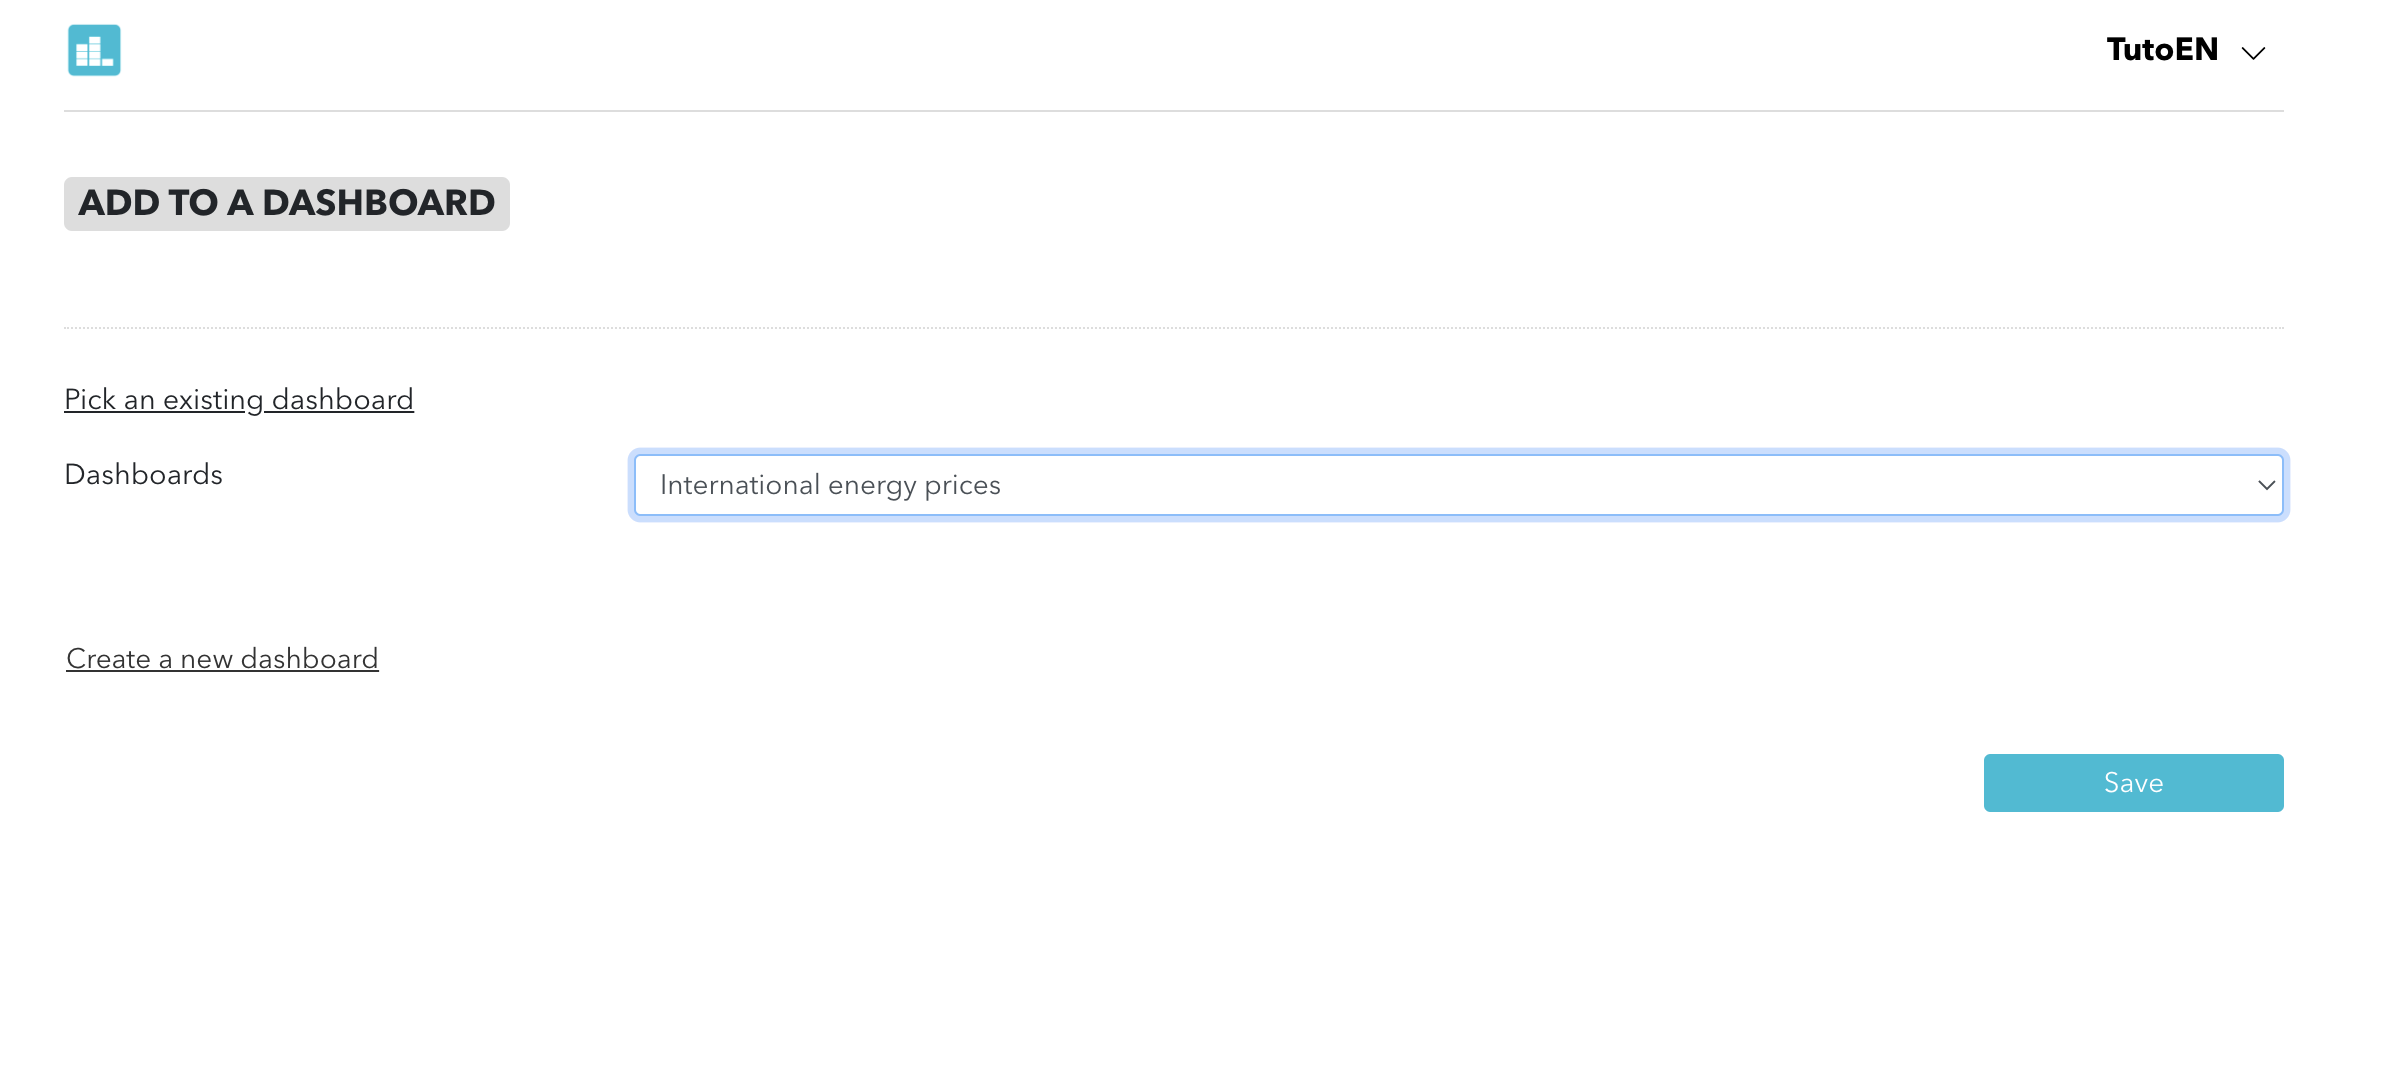
Click on "Save"
Second chart
Let's add now a second chart with oil "futures". Go to this EIA dashboard. Pick the chart with the series.
Repeat the same steps to add this chart to your dashboard.
Adding series
We have added two charts to our dashboard.
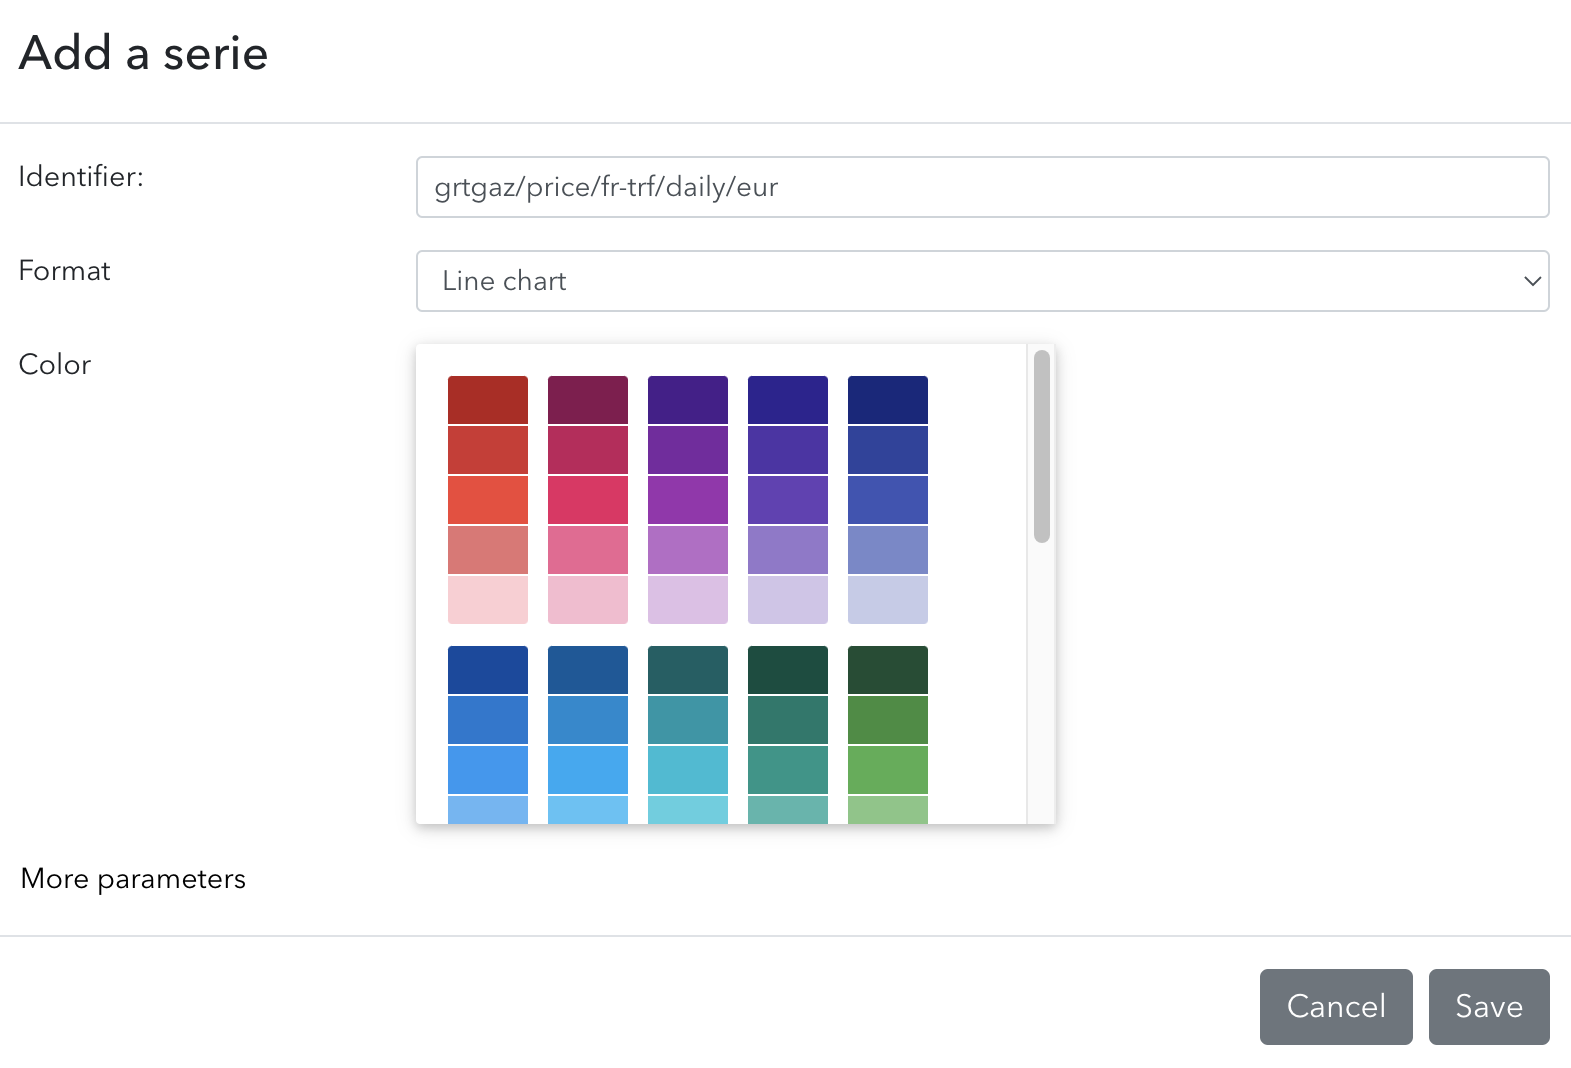
We are now going to add a serie. You can for instance visit French gas prices published by the French network operator.
On the top right, click on the heart and add to a personal dashboard. Select the dashboard, the 'Line chart' format and save.
Changing charts
After adding the serie, you are redirected to your dashboard with the three charts above.
We are going to change the last serie we have added to make it start in 2022. Click on the top right of the chart on "Update chart".
In the field "Name", write 'Natural Gas Prices in EUR/ MWh'. Then, on the section below with series, click on the toggle on the right and choose 'Update'.
In the "Start" cell, write "2022-01-01" to start on the 1st of January 2022. We use this way of writing dates with year, month and days separated with dashes on Statit.
In the "Color" section, pick a different color.
Click on 'Save'.
Accessing your dashboard
We have done this to create a dashboard that contains the key metrics we are interested in.
You will find this dashboard in your "Home" on the "Dashboard" tab. The dashboard will always be up to date with the latest values.
You can now create dashboards with series from public collections and private accounts of which you are a member.
If you want to remove the dashboard, start by removing each chart (top right of the chart) and then remove the dashboard.